DescriptionTable DataChart and Figure Data
CBHS 2016
CBHS 2016
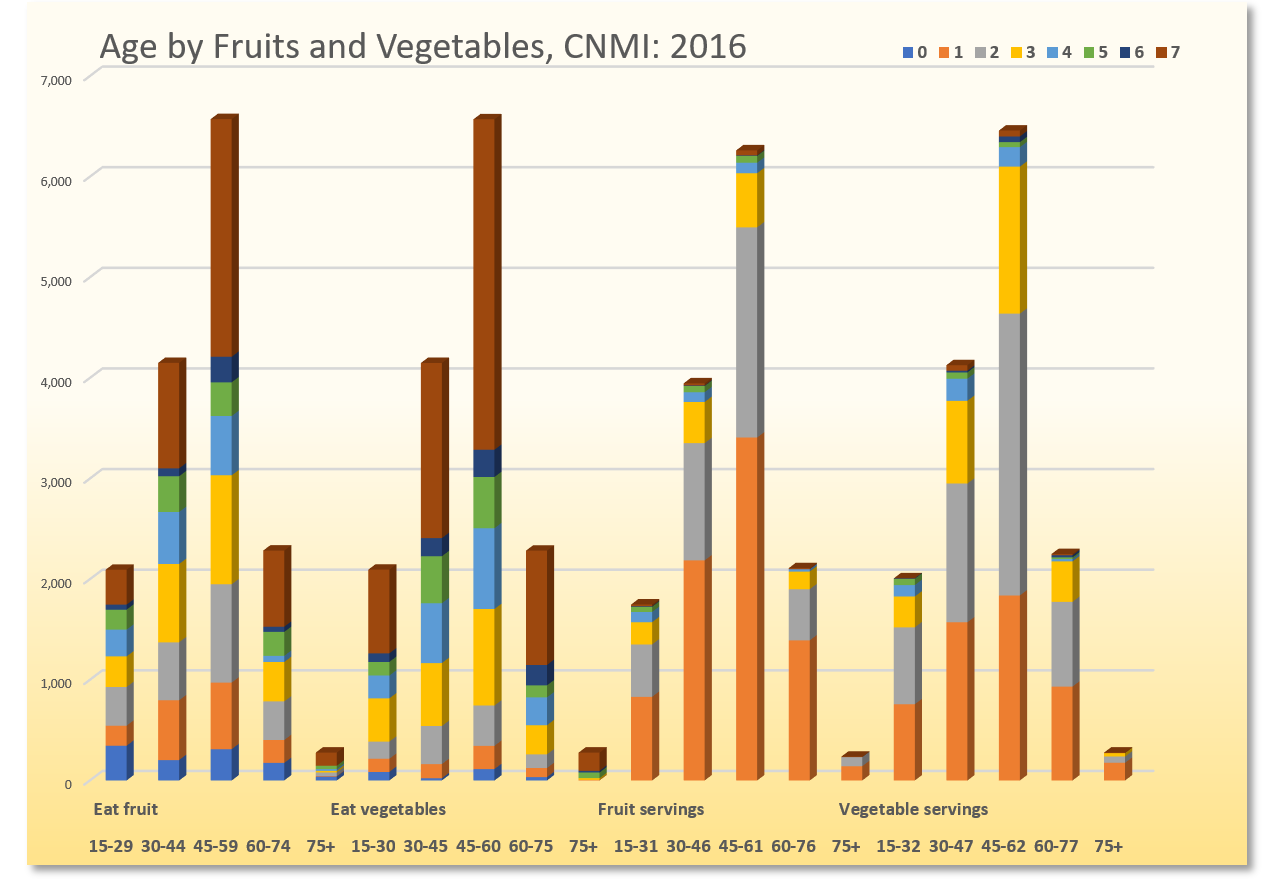
CBHS 2016 Table 20.17 Age by Fruits and Vegetables, CNMI: 2016
CNMI Behavioral Health Survey 2016
| How many times | 15-29 | 30-44 | 45-59 | 60-74 | 75+ | Median | |
|---|---|---|---|---|---|---|---|
| Source: 2016 CNMI Health Survey (CBHS and NCDS) | |||||||
| Eat fruit | 0 | 345 | 203 | 311 | 175 | 39 | 44.1 |
| Eat fruit | 1 | 199 | 594 | 662 | 227 | 6 | 46.1 |
| Eat fruit | 2 | 385 | 576 | 977 | 384 | 34 | 48.3 |
| Eat fruit | 3 | 304 | 779 | 1,083 | 391 | 17 | 47.8 |
| Eat fruit | 4 | 266 | 516 | 589 | 62 | 17 | 43.3 |
| Eat fruit | 5 | 198 | 355 | 335 | 238 | 34 | 46.2 |
| Eat fruit | 6 | 51 | 79 | 254 | 51 | – | 50.2 |
| Eat fruit | 7+ | 346 | 1,048 | 2,362 | 757 | 130 | 50.9 |
| Eat vegetables | 0 | 85 | 22 | 113 | 34 | – | 47.6 |
| Eat vegetables | 1 | 131 | 141 | 231 | 90 | 6 | 46.8 |
| Eat vegetables | 2 | 170 | 378 | 401 | 136 | – | 44.8 |
| Eat vegetables | 3 | 430 | 626 | 959 | 289 | 17 | 46.6 |
| Eat vegetables | 4 | 227 | 594 | 803 | 277 | – | 47.4 |
| Eat vegetables | 5 | 135 | 467 | 509 | 119 | 56 | 46.2 |
| Eat vegetables | 6 | 85 | 181 | 271 | 203 | 17 | 51.2 |
| Eat vegetables | 7+ | 832 | 1,740 | 3,284 | 1,136 | 181 | 49.6 |
| Fruit servings | 0 | – | – | – | – | – | 0 |
| Fruit servings | 1 | 831 | 2,187 | 3,408 | 1,392 | 142 | 49.2 |
| Fruit servings | 2 | 521 | 1,166 | 2,089 | 509 | 90 | 48.6 |
| Fruit servings | 3 | 221 | 408 | 538 | 175 | – | 46.2 |
| Fruit servings | 4 | 102 | 97 | 104 | 23 | – | 39.4 |
| Fruit servings | 5 | 51 | 62 | 68 | – | – | 39.6 |
| Fruit servings | 6 | 6 | 5 | 5 | – | – | 36.8 |
| Fruit servings | 7+ | 17 | 22 | 50 | 11 | 5 | 49 |
| Vegetable servings | 0 | – | – | – | – | – | 0 |
| Vegetable servings | 1 | 758 | 1,572 | 1,839 | 933 | 176 | 47.5 |
| Vegetable servings | 2 | 764 | 1,379 | 2,800 | 842 | 62 | 49.2 |
| Vegetable servings | 3 | 307 | 822 | 1,461 | 402 | 34 | 48.9 |
| Vegetable servings | 4 | 113 | 220 | 194 | 23 | – | 41 |
| Vegetable servings | 5 | 62 | 62 | 50 | 17 | – | 38.1 |
| Vegetable servings | 6 | 5 | 17 | 56 | 22 | – | 52.5 |
| Vegetable servings | 7+ | – | 55 | 59 | 11 | 5 | 47.5 |
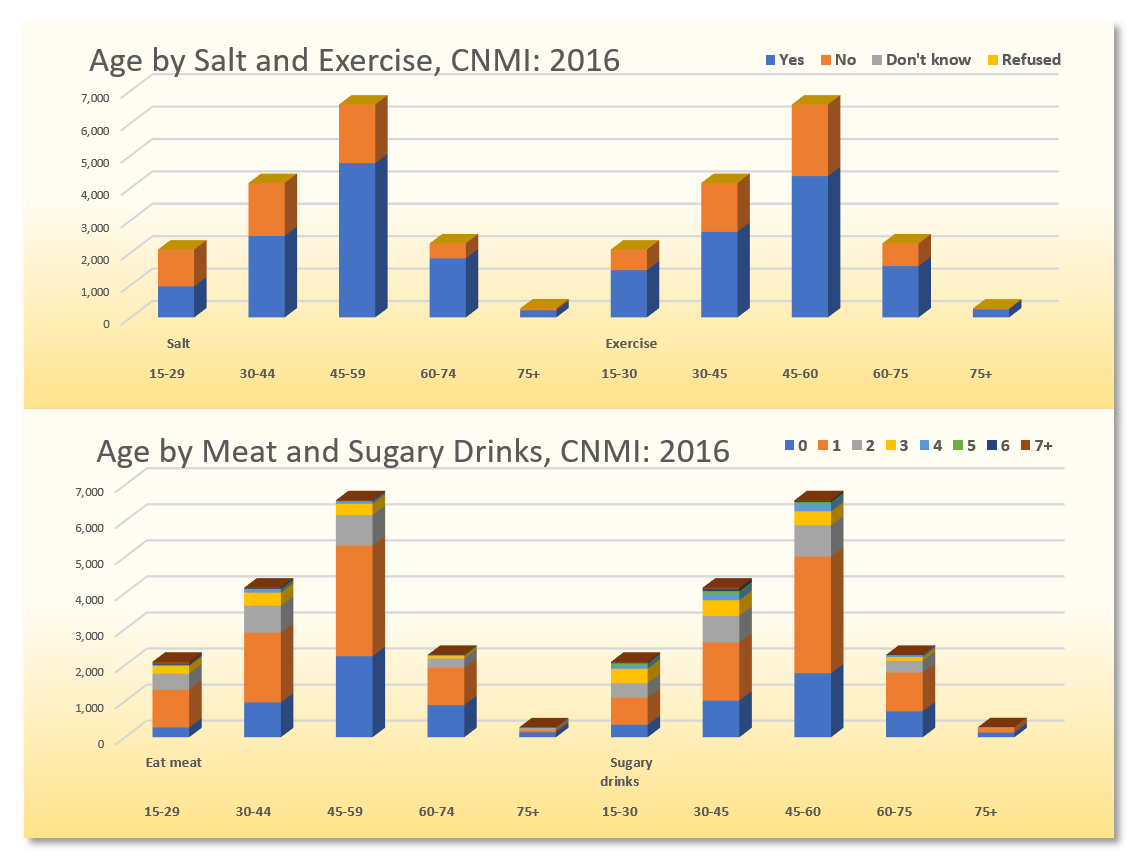
CBHS 2016 Table 20.18 Age by Salt, Exercise, Meat, and Sugary Drinks, CNMI: 2016
CNMI Behavioral Health Survey 2016
| 15-29 | 30-44 | 45-59 | 60-74 | 75+ | Median | ||
|---|---|---|---|---|---|---|---|
| Source: 2016 CNMI Health Survey (CBHS and NCDS) | |||||||
| Salt | Yes | 957 | 2,515 | 4,762 | 1,821 | 220 | 50.2 |
| Salt | No | 1,137 | 1,635 | 1,810 | 463 | 57 | 43 |
| Salt | Don’t know | – | – | – | – | – | 0 |
| Salt | Refused | – | – | – | – | – | 0 |
| Exercise | Yes | 1,460 | 2,640 | 4,360 | 1,584 | 248 | 48.6 |
| Exercise | No | 634 | 1,510 | 2,212 | 700 | 28 | 47.7 |
| Exercise | Don’t know | – | – | – | – | – | 0 |
| Exercise | Refused | – | – | – | – | – | 0 |
| Eat meat | 0 | 271 | 967 | 2,246 | 893 | 141 | 51.8 |
| Eat meat | 1 | 1,047 | 1,932 | 3,075 | 1,036 | 62 | 47.9 |
| Eat meat | 2 | 447 | 752 | 843 | 260 | 51 | 44.6 |
| Eat meat | 3 | 210 | 363 | 312 | 62 | – | 40.9 |
| Eat meat | 4 | 34 | 68 | 74 | 17 | 17 | 45.6 |
| Eat meat | 5 | – | 34 | – | 17 | – | 41.3 |
| Eat meat | 6 | 17 | 17 | – | – | – | 30 |
| Eat meat | 7+ | 68 | 18 | 23 | – | 5 | 27.5 |
| Sugary drinks | 0 | 346 | 1,017 | 1,775 | 718 | 130 | 50.3 |
| Sugary drinks | 1 | 753 | 1,612 | 3,235 | 1,075 | 124 | 49.8 |
| Sugary drinks | 2 | 401 | 735 | 872 | 328 | 23 | 45.7 |
| Sugary drinks | 3 | 401 | 436 | 385 | 102 | – | 39 |
| Sugary drinks | 4 | 96 | 169 | 198 | 56 | – | 44.5 |
| Sugary drinks | 5 | 56 | 85 | 56 | – | – | 37.5 |
| Sugary drinks | 6 | 17 | 56 | 40 | 5 | – | 41.3 |
| Sugary drinks | 7+ | 23 | 40 | 12 | – | – | 35.4 |
CBHS 2016
To download, right click on the chart and select “Save Image As”…