DescriptionTable DataChart and Figure Data
CBHS 2016
CBHS 2016
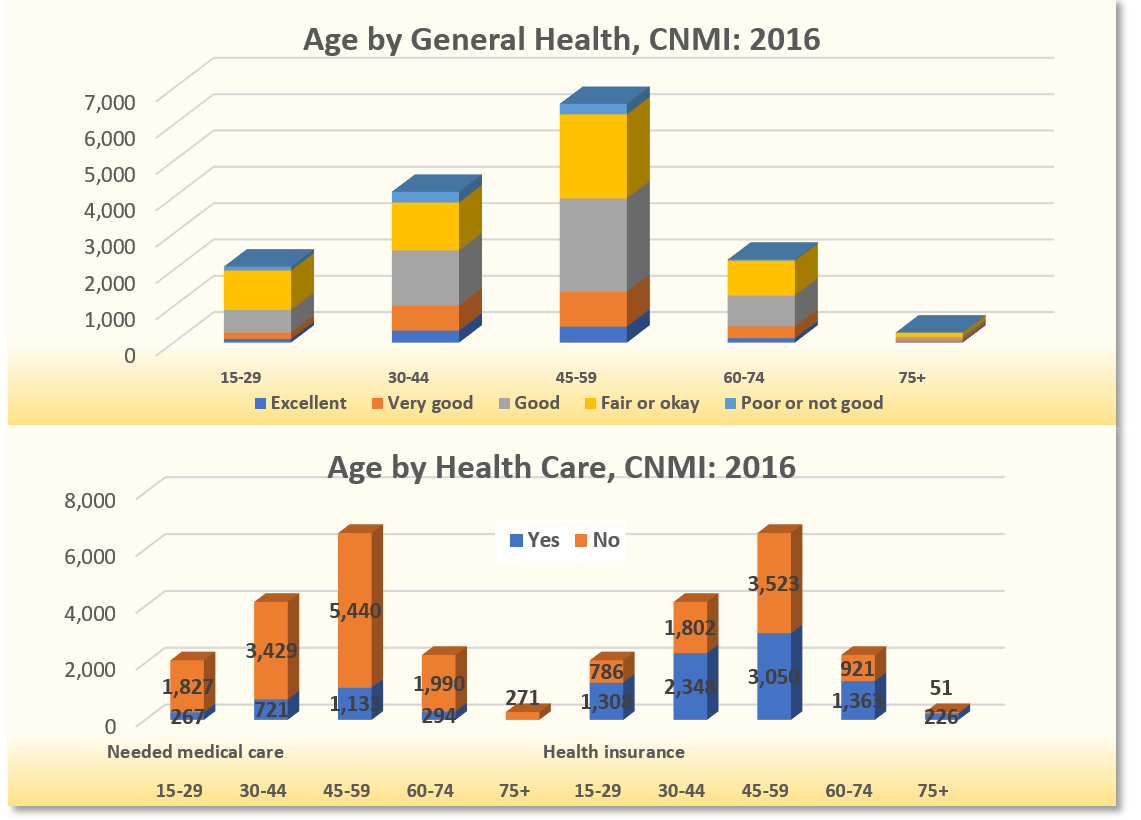
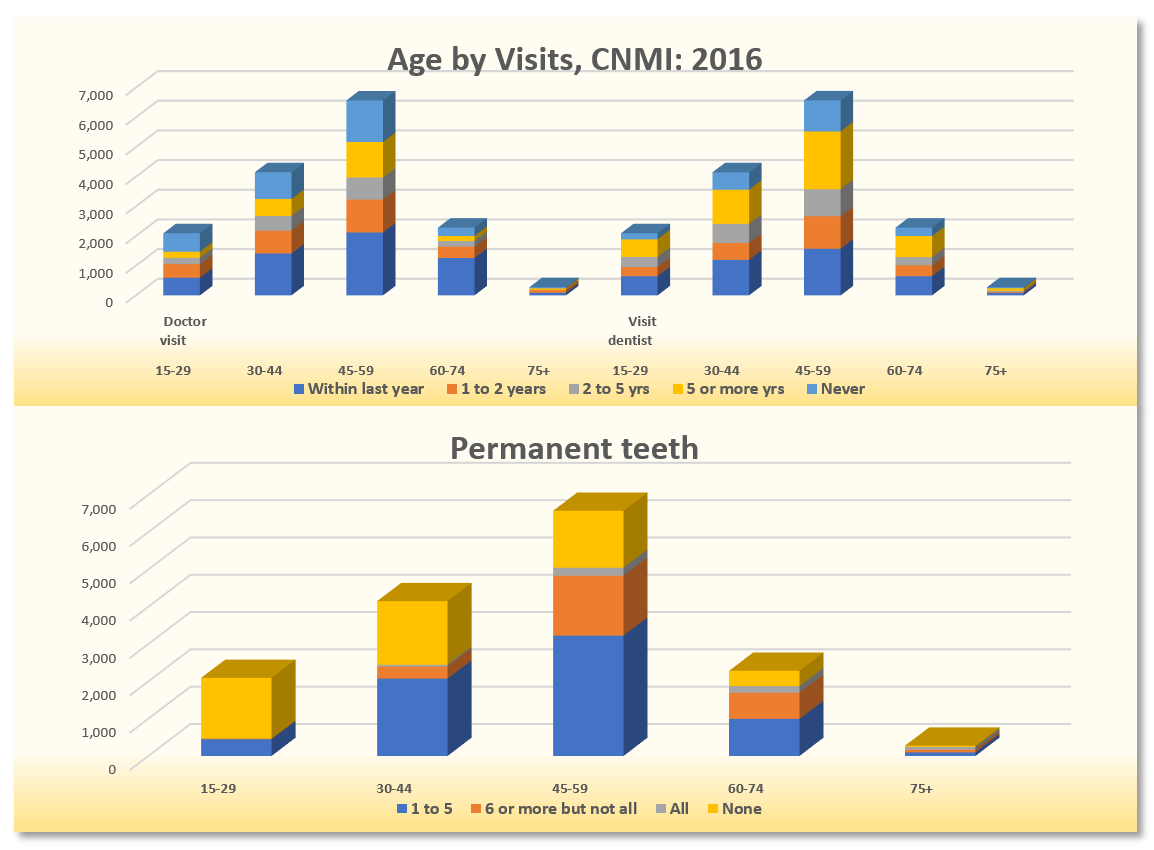
CBHS 2016 Table 20.22 Age by General Health, CNMI: 2016
CNMI Behavioral Health Survey 2016
| 15-29 | 30-44 | 45-59 | 60-74 | 75+ | Median | ||
|---|---|---|---|---|---|---|---|
| Source: 2016 CNMI Health Survey (CBHS and NCDS) | |||||||
| General health | Excellent | 102 | 329 | 441 | 119 | 17 | 47.5 |
| General health | Very good | 175 | 690 | 956 | 328 | 68 | 48.8 |
| General health | Good | 622 | 1,519 | 2,571 | 848 | 73 | 48.9 |
| General health | Fair or okay | 1,086 | 1,319 | 2,316 | 961 | 118 | 48.2 |
| General health | Poor or not good | 108 | 294 | 288 | 28 | – | 42.8 |
| time since visit | Within last year | 595 | 1,413 | 2,122 | 1,262 | 90 | 50.2 |
| time since visit | 1 to 2 years | 459 | 765 | 1,105 | 384 | 96 | 47.5 |
| time since visit | 2 to 5 yrs | 209 | 499 | 746 | 187 | – | 47.3 |
| time since visit | 5 or more yrs | 210 | 571 | 1,199 | 169 | 51 | 49 |
| time since visit | Never | 621 | 902 | 1,400 | 282 | 39 | 46.1 |
| Needed medical care | Yes | 267 | 721 | 1,133 | 294 | 5 | 47.9 |
| Needed medical care | No | 1,827 | 3,429 | 5,440 | 1,990 | 271 | 48.4 |
| Health insurance | Yes | 1,308 | 2,348 | 3,050 | 1,363 | 226 | 47.4 |
| Health insurance | No | 786 | 1,802 | 3,523 | 921 | 51 | 49.1 |
| Visit dentist | Within last year | 646 | 1,198 | 1,573 | 645 | 85 | 47.2 |
| Visit dentist | 1 to 2 years | 311 | 566 | 1,093 | 373 | 34 | 49.3 |
| Visit dentist | 2 to 5 yrs | 339 | 646 | 912 | 270 | 39 | 46.9 |
| Visit dentist | 5 or more yrs | 594 | 1,153 | 1,949 | 713 | 84 | 48.8 |
| Visit dentist | Never | 203 | 586 | 1,046 | 283 | 34 | 49.1 |
| Permanent teeth | 1 to 5 | 448 | 2,073 | 3,226 | 994 | 96 | 49.2 |
| Permanent teeth | 6 or more but not all | 17 | 322 | 1,606 | 702 | 68 | 54.5 |
| Permanent teeth | All | – | 51 | 215 | 175 | 79 | 59.6 |
| Permanent teeth | None | 1,629 | 1,704 | 1,525 | 412 | 34 | 39 |
CBHS 2016
To download, right click on the chart and select “Save Image As”…


