IntroTable DataCharts and Figures Data
Economic Indicator
Economic Indicator (EI) Data as it relates to Banking: Deposits, quarters 1 through 4. Banking Annual Reports are reflected off the 4th Quarter of their respected Year
Economic Indicator
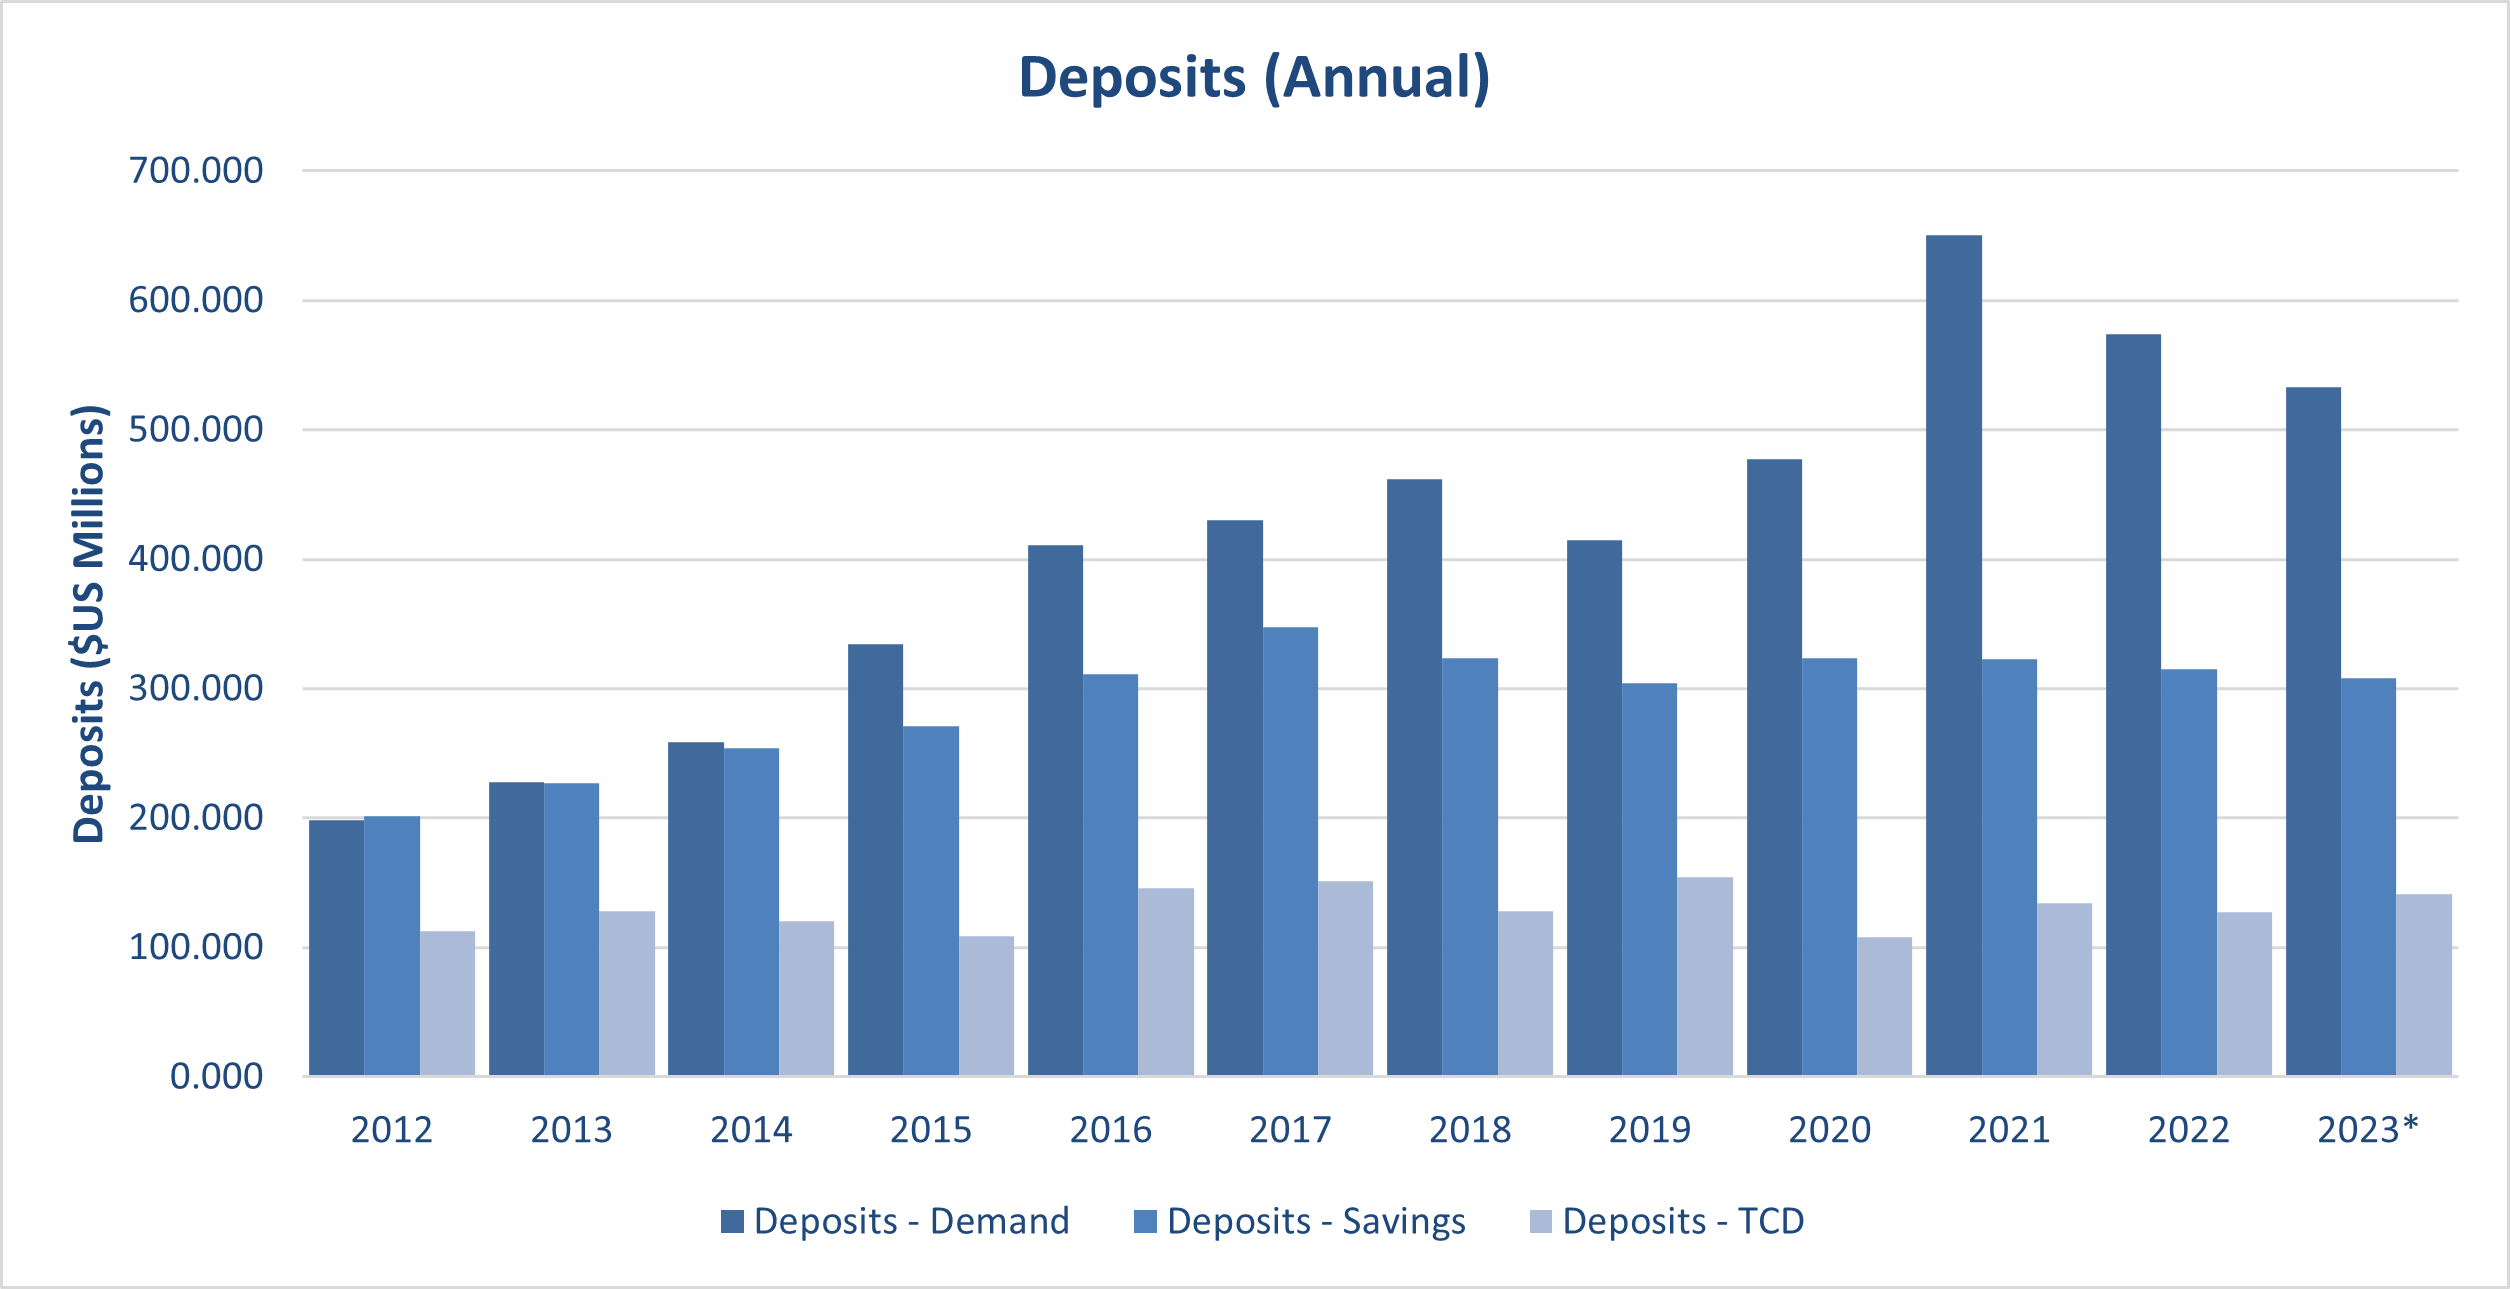
EI Banking Deposits (Annual)
Annual Deposits Economic Indicator
Units of Measure= $USD (Millions)
Source: Banking Section, Department of Commerce; Values are rounded to the nearest Hundredth
| Year | Demand | Savings | TCD | % Change from Previous Year |
|---|---|---|---|---|
| Source: CNMI Economic Indicators / CSD | ||||
| 2023* | $533.02 | $307.92 | $141.45 | -3.41% |
| 2022 | $574.38 | $315.27 | $574.38 | -8.18% |
| 2021 | $650.69 | $322.80 | $134.26 | 21.92% |
| 2020 | $477.10 | $323.34 | $108.15 | 4.04% |
| 2019 | $414.55 | $304.61 | $154.12 | -4.35% |
| 2018 | $461.92 | $323.33 | $127.75 | -1.66% |
| 2017 | $429.90 | $347.51 | $150.98 | 6.98% |
| 2016 | $411.07 | $311.03 | $145.70 | 21.48% |
| 2015 | $334.63 | $270.94 | $108.76 | 12.86% |
| 2014 | $259.07 | $253.70 | $120.19 | 8.51% |
| 2013 | $227.58 | $227.38 | $128.36 | 13.86% |
| 2012 | $198.10 | $201.35 | $112.87 | 10.92% |
| 2011 | $171.26 | $179.79 | $110.86 | 1.62% |
| 2010 | $174.12 | $157.17 | $123.25 | 2.05% |
| 2009 | $144.41 | $151.85 | $149.16 | -1.15% |
| 2008 | $135.56 | $117.86 | $197.18 | -15.17% |
| 2007 | $156.85 | $143.25 | $231.10 | 2.57% |
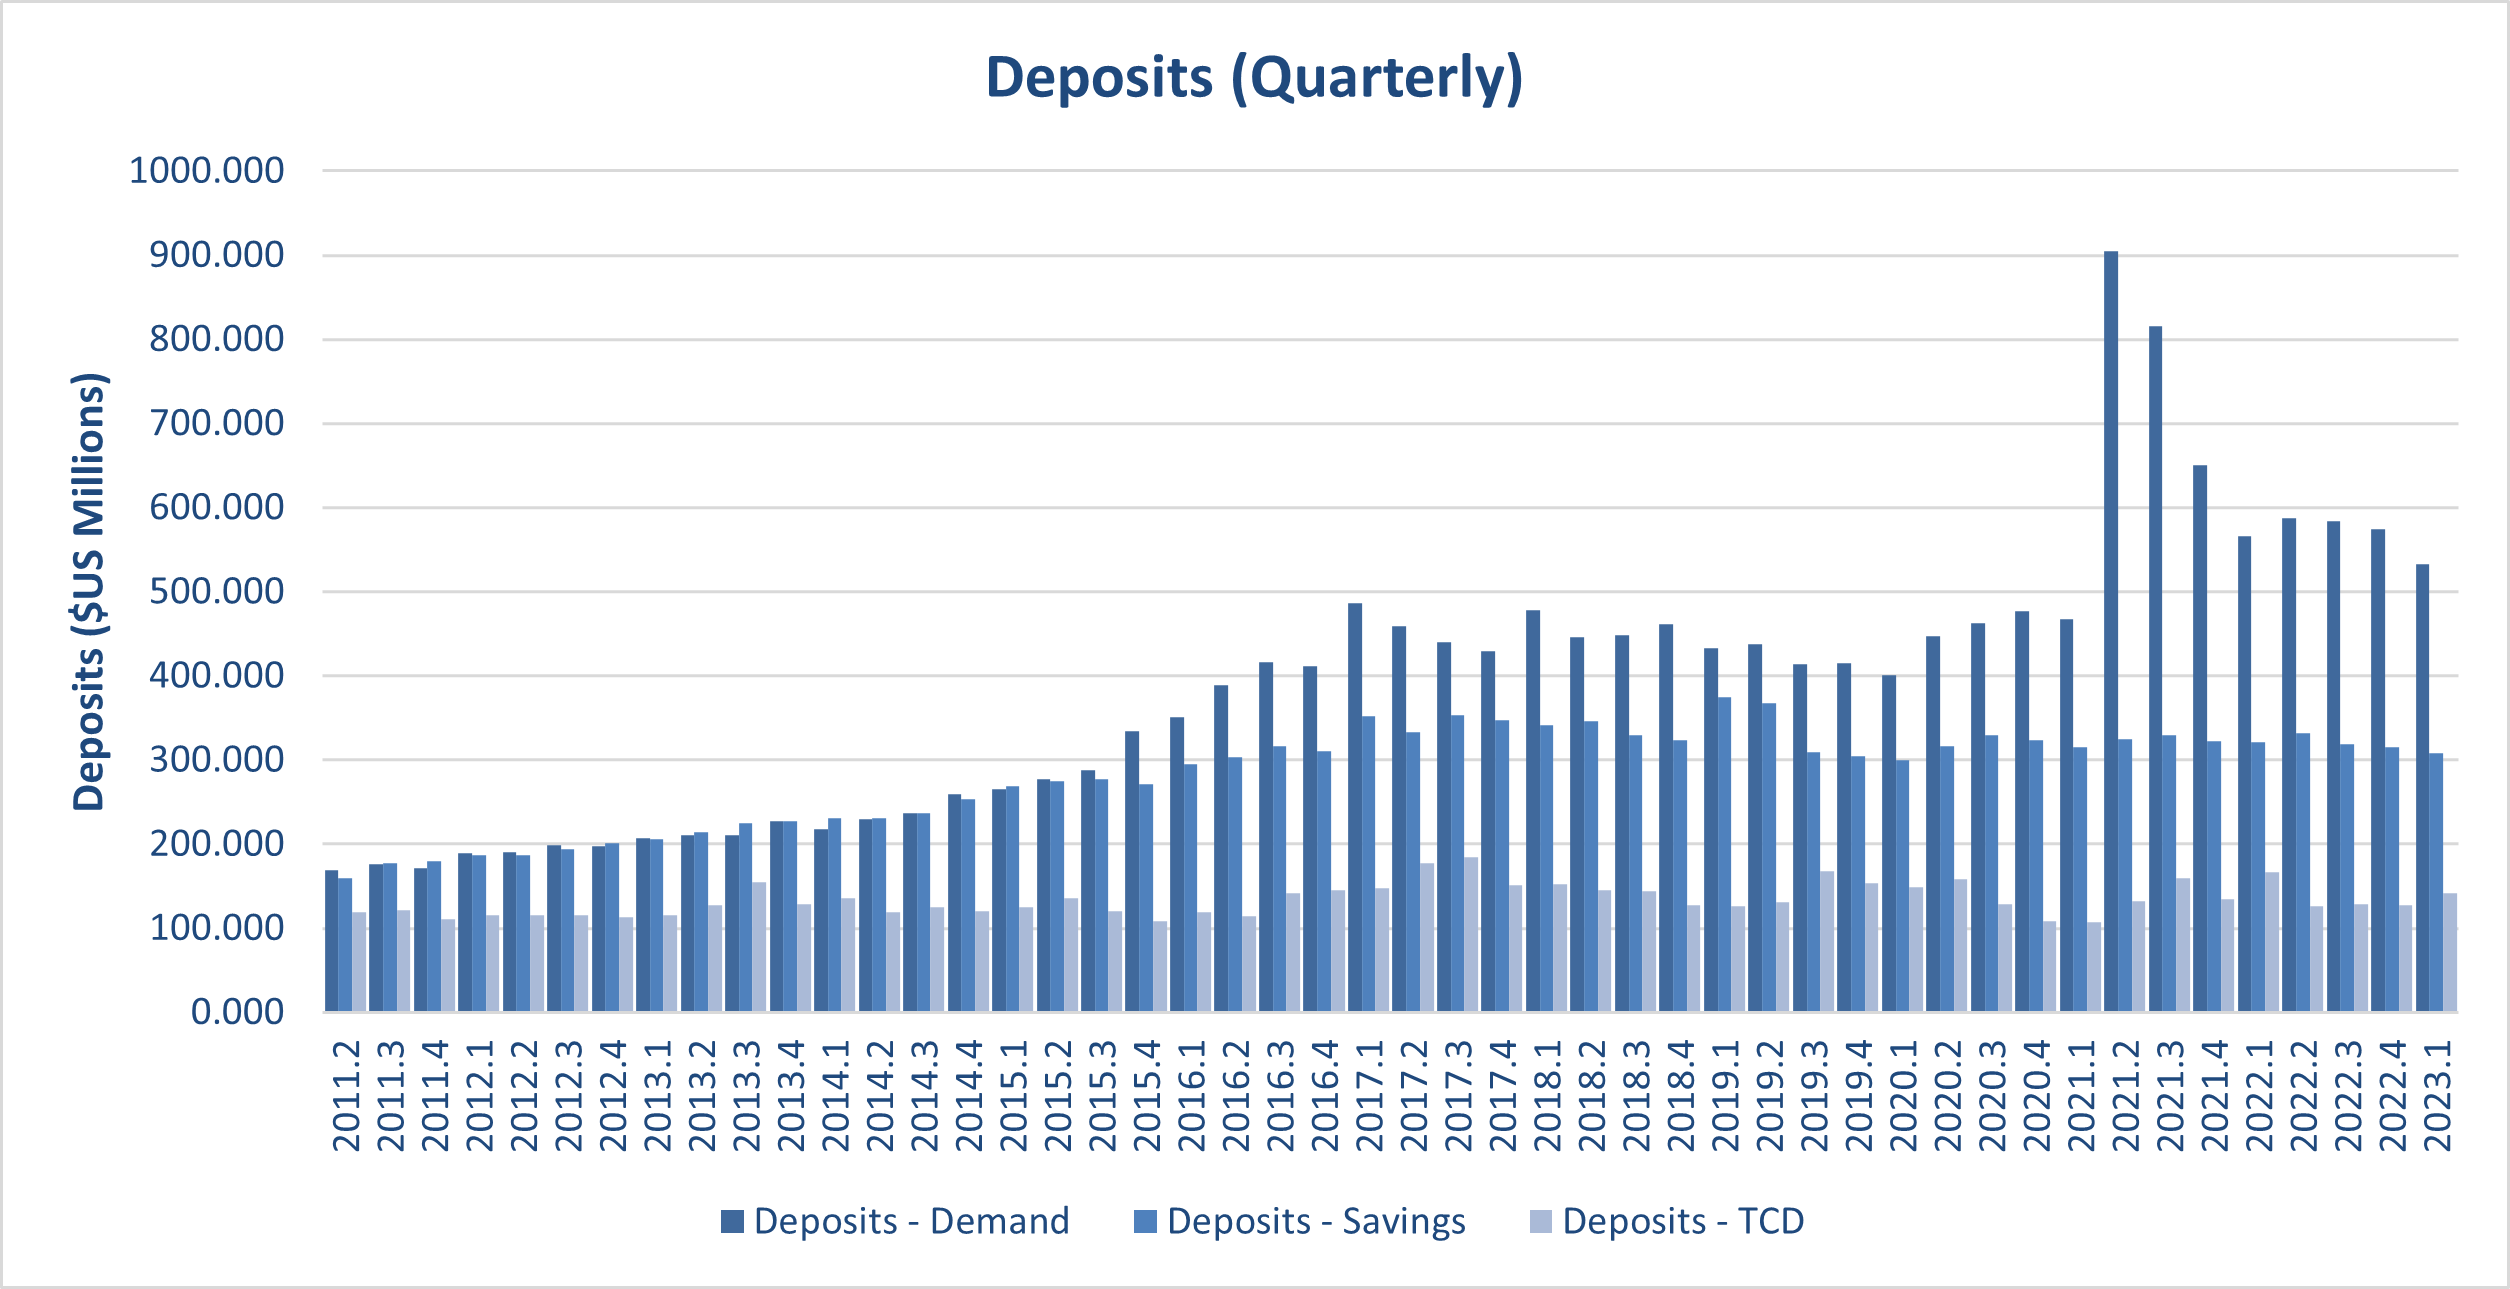
EI Banking Deposits (Quarterly)
Quarterly Deposits Economic Indicator
Units of Measure= $USD (Millions)
Source: Banking Section, Department of Commerce; Values are rounded to the nearest Hundredth
| Deposits | Demand | Savings | TCD | % Change From Previous Quarter |
|---|---|---|---|---|
| Source: CNMI Economic Indicators / CSD | ||||
| 2023.1 | $533.02 | $307.92 | $141.45 | -3.41% |
| 2022.4 | $574.38 | $315.27 | $574.38 | -1.23% |
| 2022.3 | $583.34 | $318.33 | $128.08 | -1.57% |
| 2022.2 | $587.93 | $331.44 | $126.80 | -0.70% |
| 2022.1 | $565.54 | $321.39 | $166.67 | -4.89% |
| 2021.4 | $650.69 | $322.80 | $134.26 | -15.05% |
| 2021.3 | $815.84 | $328.93 | $159.19 | -4.28% |
| 2021.2 | $905.39 | $324.33 | $132.50 | 53.19% |
| 2021.1 | $467.33 | $314.77 | $107.13 | -2.13% |
| 2020.4 | $477.10 | $323.34 | $108.15 | -1.25% |
| 2020.3 | $462.42 | $329.09 | $128.56 | -0.32% |
| 2020.2 | $447.26 | $316.95 | $158.85 | 8.76% |
| 2020.1 | $401.22 | $299.21 | $148.28 | -2.81% |
| 2019.4 | $414.55 | $304.61 | $154.12 | -2.01% |
| 2019.3 | $414.47 | $308.83 | $167.87 | -4.84% |
| 2019.2 | $437.54 | $367.68 | $131.26 | 0.22% |
| 2019.1 | $432.94 | $374.98 | $126.52 | 2.35% |
| 2018.4 | $461.92 | $323.33 | $127.75 | -0.96% |
| 2018.3 | $448.28 | $329.56 | $144.03 | -1.59% |
| 2018.2 | $445.56 | $346.09 | $145.16 | -3.52% |
| 2018.1 | $477.77 | $341.38 | $151.82 | 4.59% |
| 2017.4 | $429.90 | $347.51 | $150.98 | -5.09% |
| 2017.3 | $439.93 | $353.29 | $184.96 | 0.92% |
| 2017.2 | $459.52 | $332.71 | $177.07 | -1.75% |
| 2017.1 | $485.98 | $352.40 | $148.21 | 13.69% |
| 2016.4 | $411.07 | $311.03 | $145.70 | -0.69% |
| 2016.3 | $415.88 | $316.00 | $141.95 | 8.23% |
| 2016.2 | $389.16 | $303.35 | $114.86 | 5.70% |
| 2016.1 | $350.53 | $294.80 | $118.53 | 6.93% |
| 2015.4 | $334.63 | $270.94 | $108.76 | 4.15% |
| 2015.3 | $288.39 | $276.93 | $120.52 | -0.28% |
| 2015.2 | $276.97 | $275.08 | $135.73 | 4.32% |
| 2015.1 | $264.85 | $269.38 | $125.05 | 4.16% |
| 2014.4 | $259.07 | $253.70 | $120.19 | 5.74% |
| 2014.3 | $237.02 | $236.39 | $125.21 | 3.38% |
| 2014.2 | $229.96 | $230.30 | $118.78 | -0.88% |
| 2014.1 | $217.67 | $230.91 | $135.59 | 0.15% |
| 2013.4 | $227.58 | $227.38 | $128.36 | -1.15% |
| 2013.3 | $210.81 | $224.46 | $154.81 | 6.92% |
| 2013.2 | $210.13 | $214.59 | $127.15 | 4.16% |
| 2013.1 | $207.39 | $206.41 | $116.03 | 3.42% |
| 2012.4 | $198.10 | $201.35 | $112.87 | 0.63% |
| 2012.3 | $198.98 | $194.34 | $115.79 | 3.12% |
| 2012.2 | $190.75 | $187.40 | $115.54 | 0.44% |
| 2012.1 | $188.91 | $186.99 | $115.62 | 6.41% |
| 2011.4 | $171.26 | $179.79 | $110.86 | -2.57% |
| 2011.3 | $176.30 | $176.90 | $120.89 | 6.11% |
| 2011.2 | $168.57 | $159.40 | $118.84 | -3.79% |
| 2011.1 | $177.61 | $161.53 | $125.29 | 2.17% |
| 2010.4 | $174.12 | $157.17 | $123.25 | 0.41% |
| 2010.3 | $163.48 | $158.35 | $130.87 | -0.43% |
| 2010.2 | $150.19 | $149.93 | $154.54 | -1.18% |
| 2010.1 | $151.30 | $157.73 | $151.08 | 3.30% |
| 2009.4 | $144.41 | $151.85 | $149.16 | -3.40% |
| 2009.3 | $130.64 | $148.23 | $182.25 | -1.42% |
| 2009.2 | $131.79 | $139.40 | $196.55 | 3.89% |
| 2009.1 | $134.98 | $129.10 | $186.15 | -0.08% |
| 2008.4 | $135.56 | $117.86 | $197.18 | 0.95% |
| 2008.3 | $140.24 | $114.10 | $192.00 | -6.79% |
| 2008.2 | $144.68 | $131.00 | $203.17 | -7.12% |
| 2008.1 | $152.14 | $133.63 | $229.76 | -2.95% |
| 2007.4 | $156.85 | $143.25 | $231.10 | 3.29% |
| 2007.3 | $143.39 | $141.85 | $229.02 | 0.46% |
| 2007.2 | $142.80 | $149.52 | $219.59 | -2.79% |
| 2007.1 | $156.02 | $152.29 | $218.26 | 1.67% |
Economic Indicator
To download, right click on the chart and select “Save Image As”…