


IntroTable DataCharts and Figures Data
Economic Indicator **Data will be updated once it is available**
Economic Indicator (EI) Data as it relates to Hotels Daily Rates, quarters 1 through 4. Hotels Daily Rates Annual Reports are reflected off the 4th Quarter of their respected Year
Economic Indicator **Data will be updated once it is available**
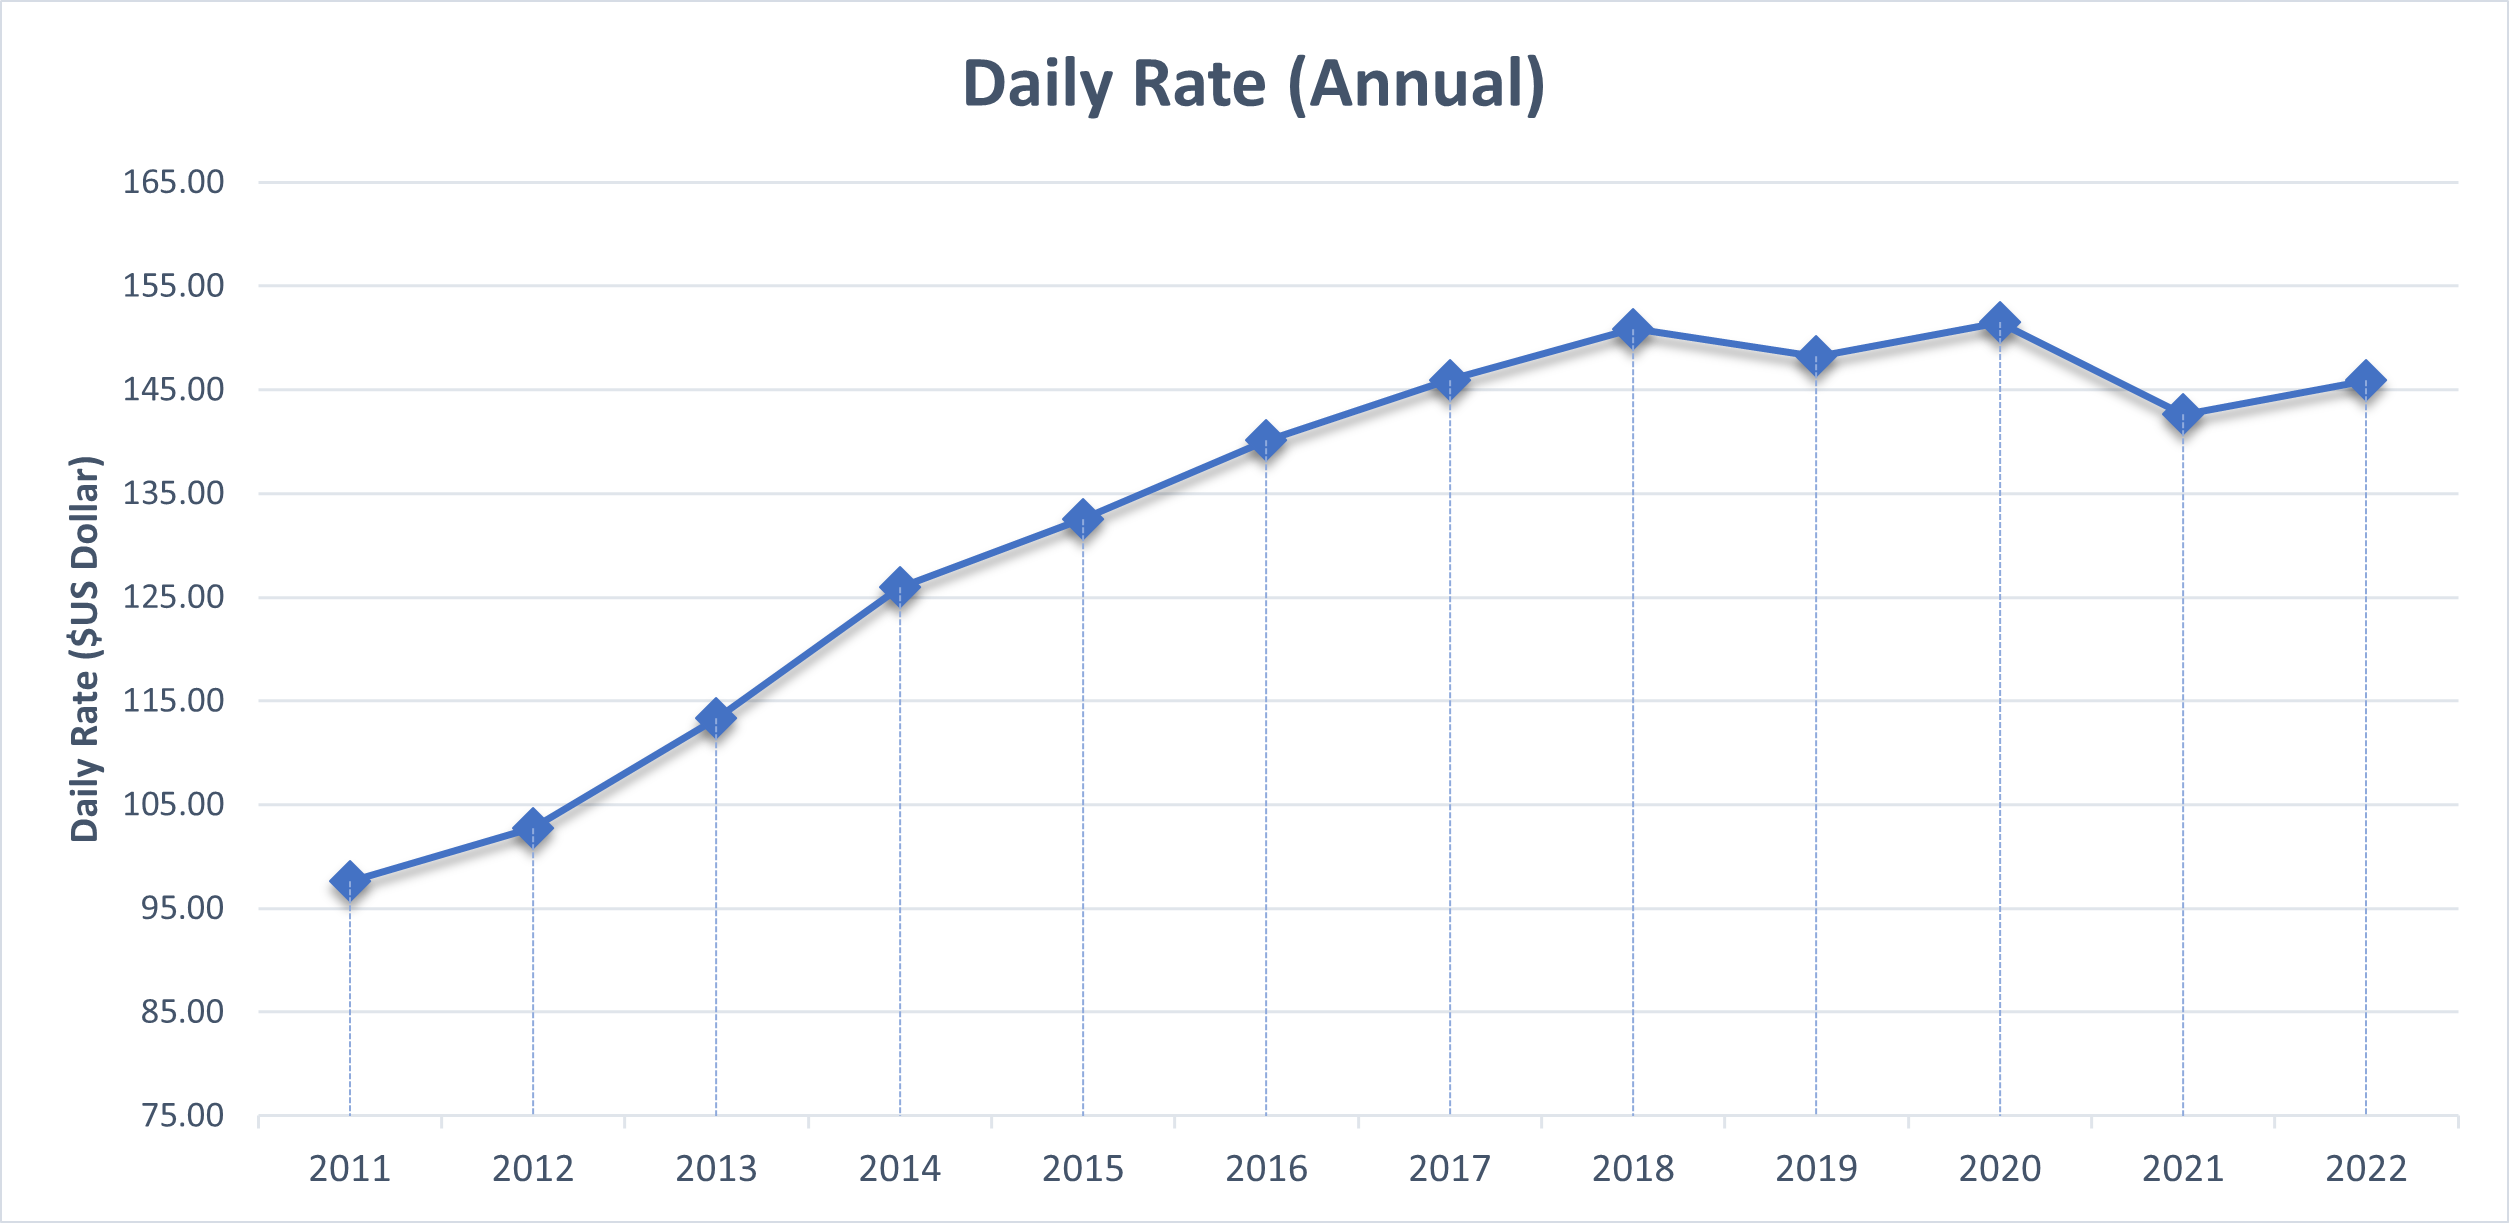
Hotel Daily Rates (Annual)
Hotel Daily Rates Economic Indicator
Note: All Percent are Rounded to the Nearest Hundredth
Units of Measure= $USD (Millions)
Source: Hotel Association of the Northern Mariana Islands (HANMI). Data from HANMI members only.
| Average Daily Rates ($) | % Change from Previous Year | |
|---|---|---|
| Source: CNMI Economic Indicators / CSD | ||
| 2022 | $145.88 | 2.27% |
| 2021 | $142.64 | -5.86% |
| 2020 | $151.51 | 2.24% |
| 2019 | $148.20 | -1.77% |
| 2018 | $150.86 | 3.38% |
| 2017 | $145.93 | 4.14% |
| 2016 | $140.12 | 5.73% |
| 2015 | $132.53 | 5.22% |
| 2014 | $125.95 | 11.14% |
| 2013 | $113.32 | 10.31% |
| 2012 | $102.73 | 5.25% |
| 2011 | $97.61 | 2.68% |
| 2010 | $95.07 | -0.16% |
| 2009 | $95.22 | -28.15% |
| 2008 | $132.53 | 5.22% |
| 2007 | $125.95 | 39.94% |
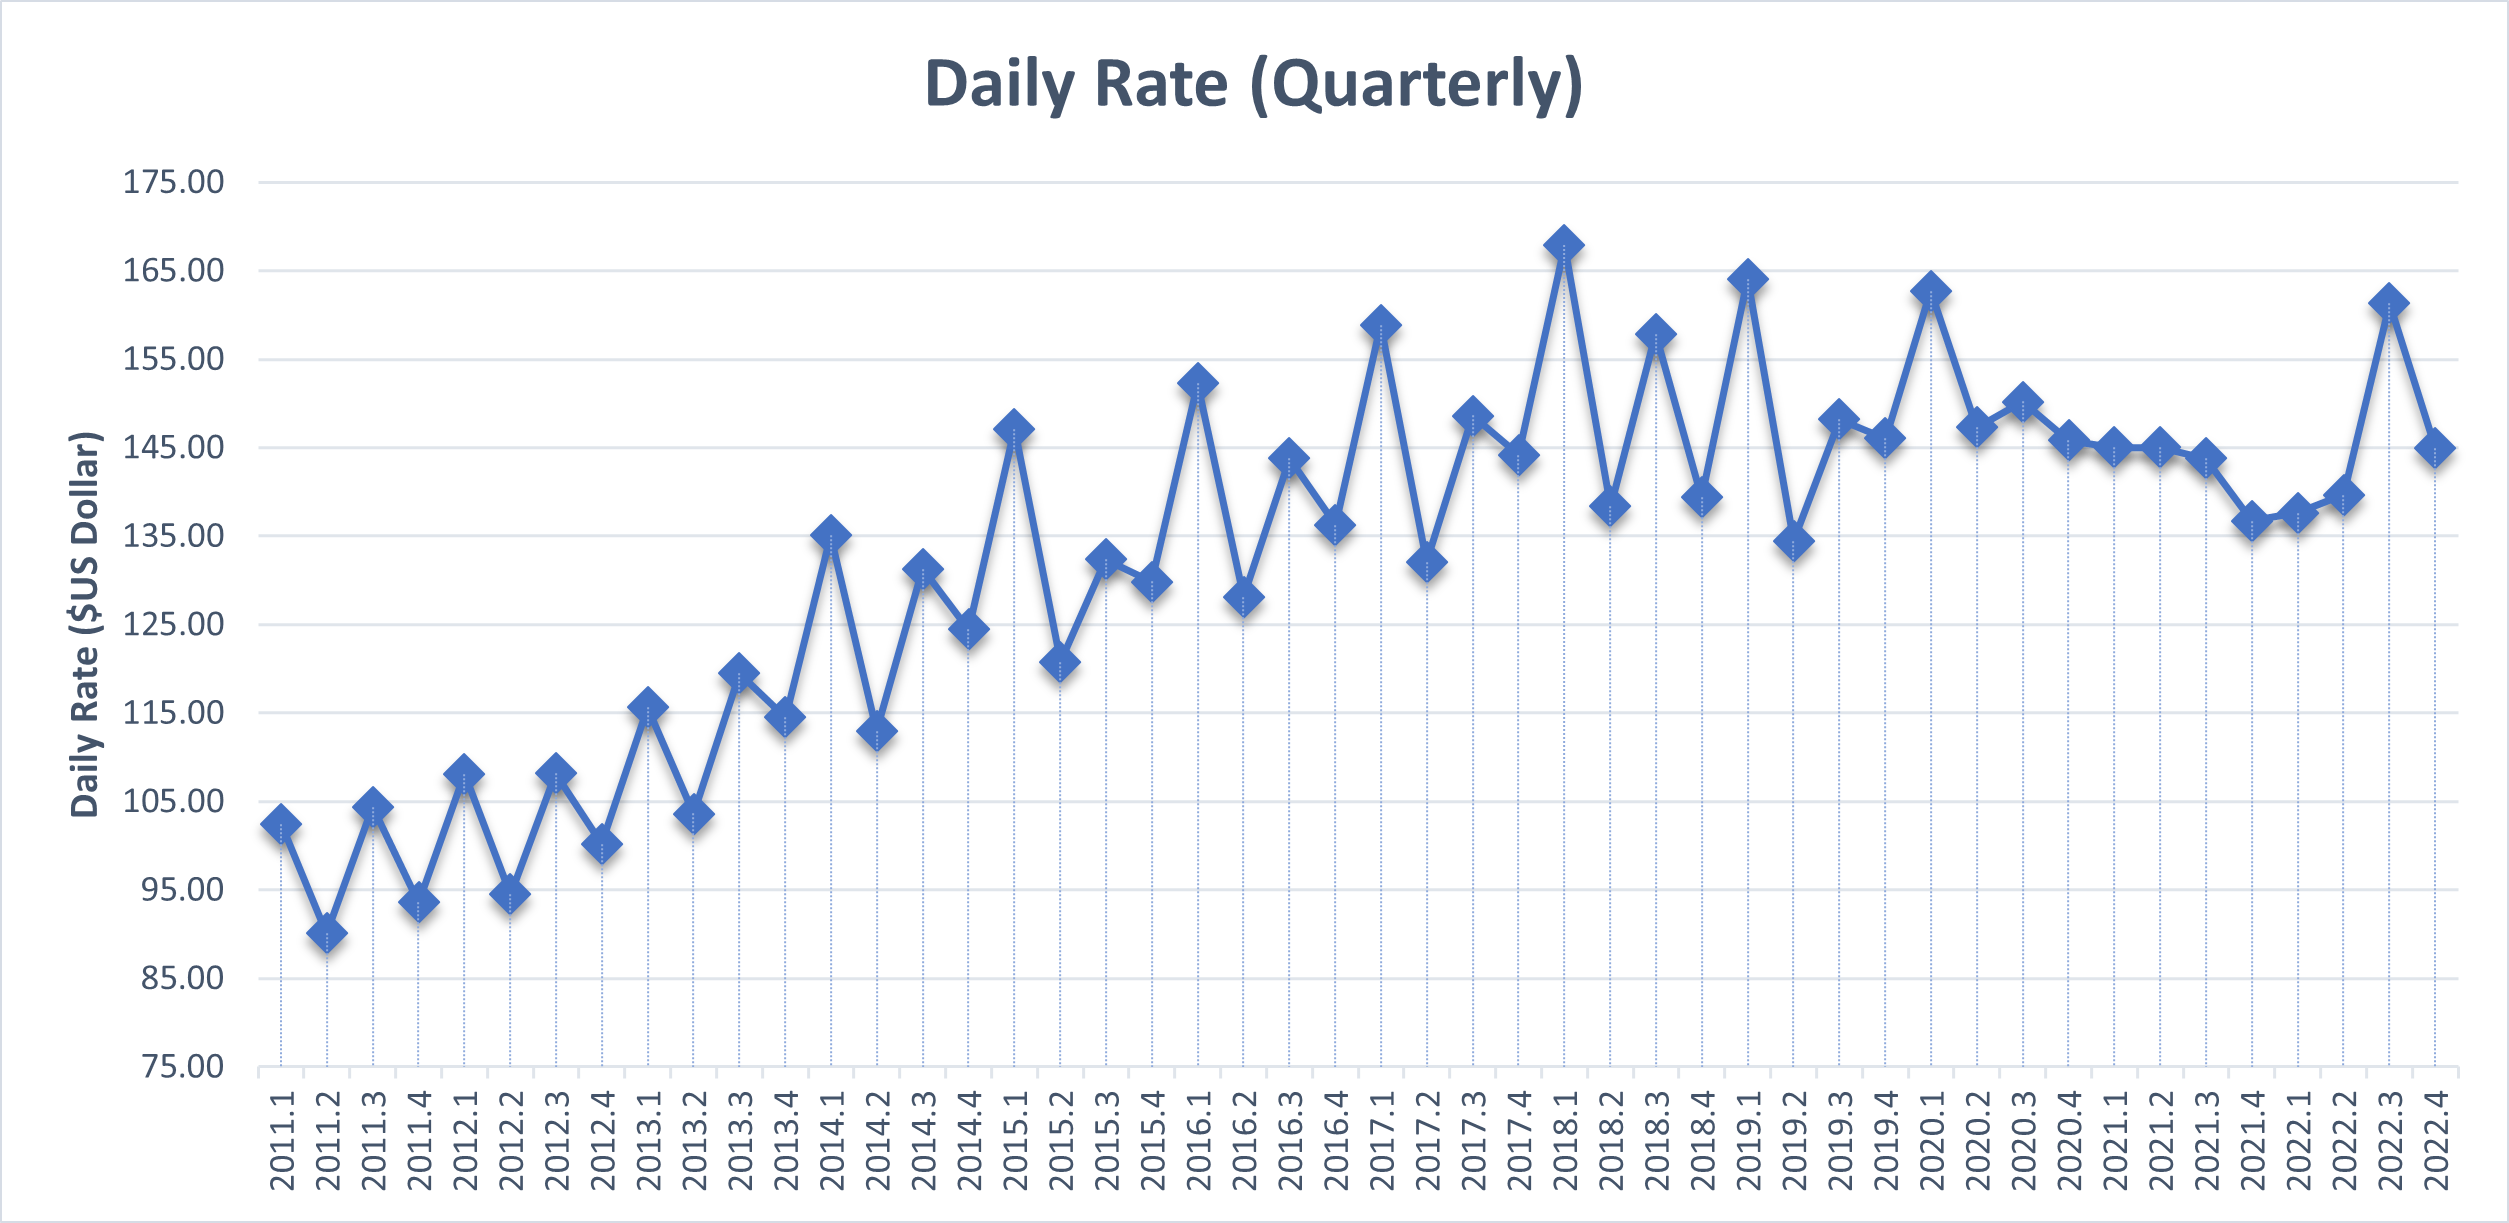
Hotel Daily Rates (Quarterly)
Hotel Daily Rates Quarterly Economic Indicator
Note: All Percent are Rounded to the Nearest Hundredth
Units of Measure= $USD (Millions)
Source: Hotel Association of the Northern Mariana Islands (HANMI). Data from HANMI members only.
| Average Daily Rates ($) | % Change from Previous Quarter | |
|---|---|---|
| Source: CNMI Economic Indicators / CSD | ||
| 2022.4 | $144.91 | -10.18% |
| 2022.3 | $161.33 | 15.51% |
| 2022.2 | $139.67 | 1.48% |
| 2022.1 | $137.62 | 0.67% |
| 2021.4 | $136.70 | -4.92% |
| 2021.3 | $143.78 | -0.86% |
| 2021.2 | $145.02 | -0.02% |
| 2021.1 | $145.05 | -0.53% |
| 2020.4 | $145.82 | -2.92% |
| 2020.3 | $150.20 | 1.98% |
| 2020.2 | $147.29 | -9.48% |
| 2020.1 | $162.72 | 11.40% |
| 2019.4 | $146.07 | -1.43% |
| 2019.3 | $148.19 | 10.21% |
| 2019.2 | $134.47 | -18.04% |
| 2019.1 | $164.06 | 17.72% |
| 2018.4 | $139.36 | -11.72% |
| 2018.3 | $157.86 | 14.10% |
| 2018.2 | $138.35 | -17.58% |
| 2018.1 | $167.87 | 16.45% |
| 2017.4 | $144.15 | -3.01% |
| 2017.3 | $148.62 | 12.53% |
| 2017.2 | $132.08 | -16.86% |
| 2017.1 | $158.87 | 16.57% |
| 2016.4 | $136.29 | -5.23% |
| 2016.3 | $143.81 | 12.22% |
| 2016.2 | $128.15 | -15.83% |
| 2016.1 | $152.25 | 17.25% |
| 2015.4 | $129.85 | -1.92% |
| 2015.3 | $132.39 | 9.61% |
| 2015.2 | $120.78 | -17.89% |
| 2015.1 | $147.09 | 18.21% |
| 2014.4 | $124.43 | -5.23% |
| 2014.3 | $131.31 | 16.25% |
| 2014.2 | $112.96 | -16.39% |
| 2014.1 | $135.10 | 17.96% |
| 2013.4 | $114.53 | -4.16% |
| 2013.3 | $119.50 | 15.32% |
| 2013.2 | $103.63 | -10.38% |
| 2013.1 | $115.63 | 15.42% |
| 2012.4 | $100.18 | -7.40% |
| 2012.3 | $108.18 | 14.50% |
| 2012.2 | $94.48 | -12.59% |
| 2012.1 | $108.09 | 15.51% |
| 2011.4 | $93.58 | -10.33% |
| 2011.3 | $104.36 | 15.82% |
| 2011.2 | $90.10 | -12.01% |
| 2011.1 | $102.41 | 9.73% |
| 2010.4 | $93.32 | -5.58% |
| 2010.3 | $98.83 | 10.73% |
| 2010.2 | $89.26 | -9.70% |
| 2010.1 | $98.85 | 6.37% |
| 2009.4 | $92.92 | -3.77% |
| 2009.3 | $96.56 | 5.65% |
| 2009.2 | $91.40 | -8.59% |
| 2009.1 | $99.99 | -23.00% |
| 2008.4 | $129.85 | -1.92% |
| 2008.3 | $132.39 | 9.61% |
| 2008.2 | $120.78 | -17.89% |
| 2008.1 | $147.09 | 18.21% |
| 2007.4 | $124.43 | -5.23% |
| 2007.3 | $131.31 | 16.25% |
| 2007.2 | $112.96 | -16.39% |
| 2007.1 | $135.10 | -0.88% |
Economic Indicator **Data will be updated once it is available**
To download, right click on the chart and select “Save Image As”…
* = Year to Date
* = Year to Date