IntroTable DataCharts and Figures Data
Economic Indicator
Economic Indicator (EI) Data as it relates to Remittance, quarters 1 through 4. Remittance Annual Reports are reflected off the 4th Quarter of their respected Year
Economic Indicator
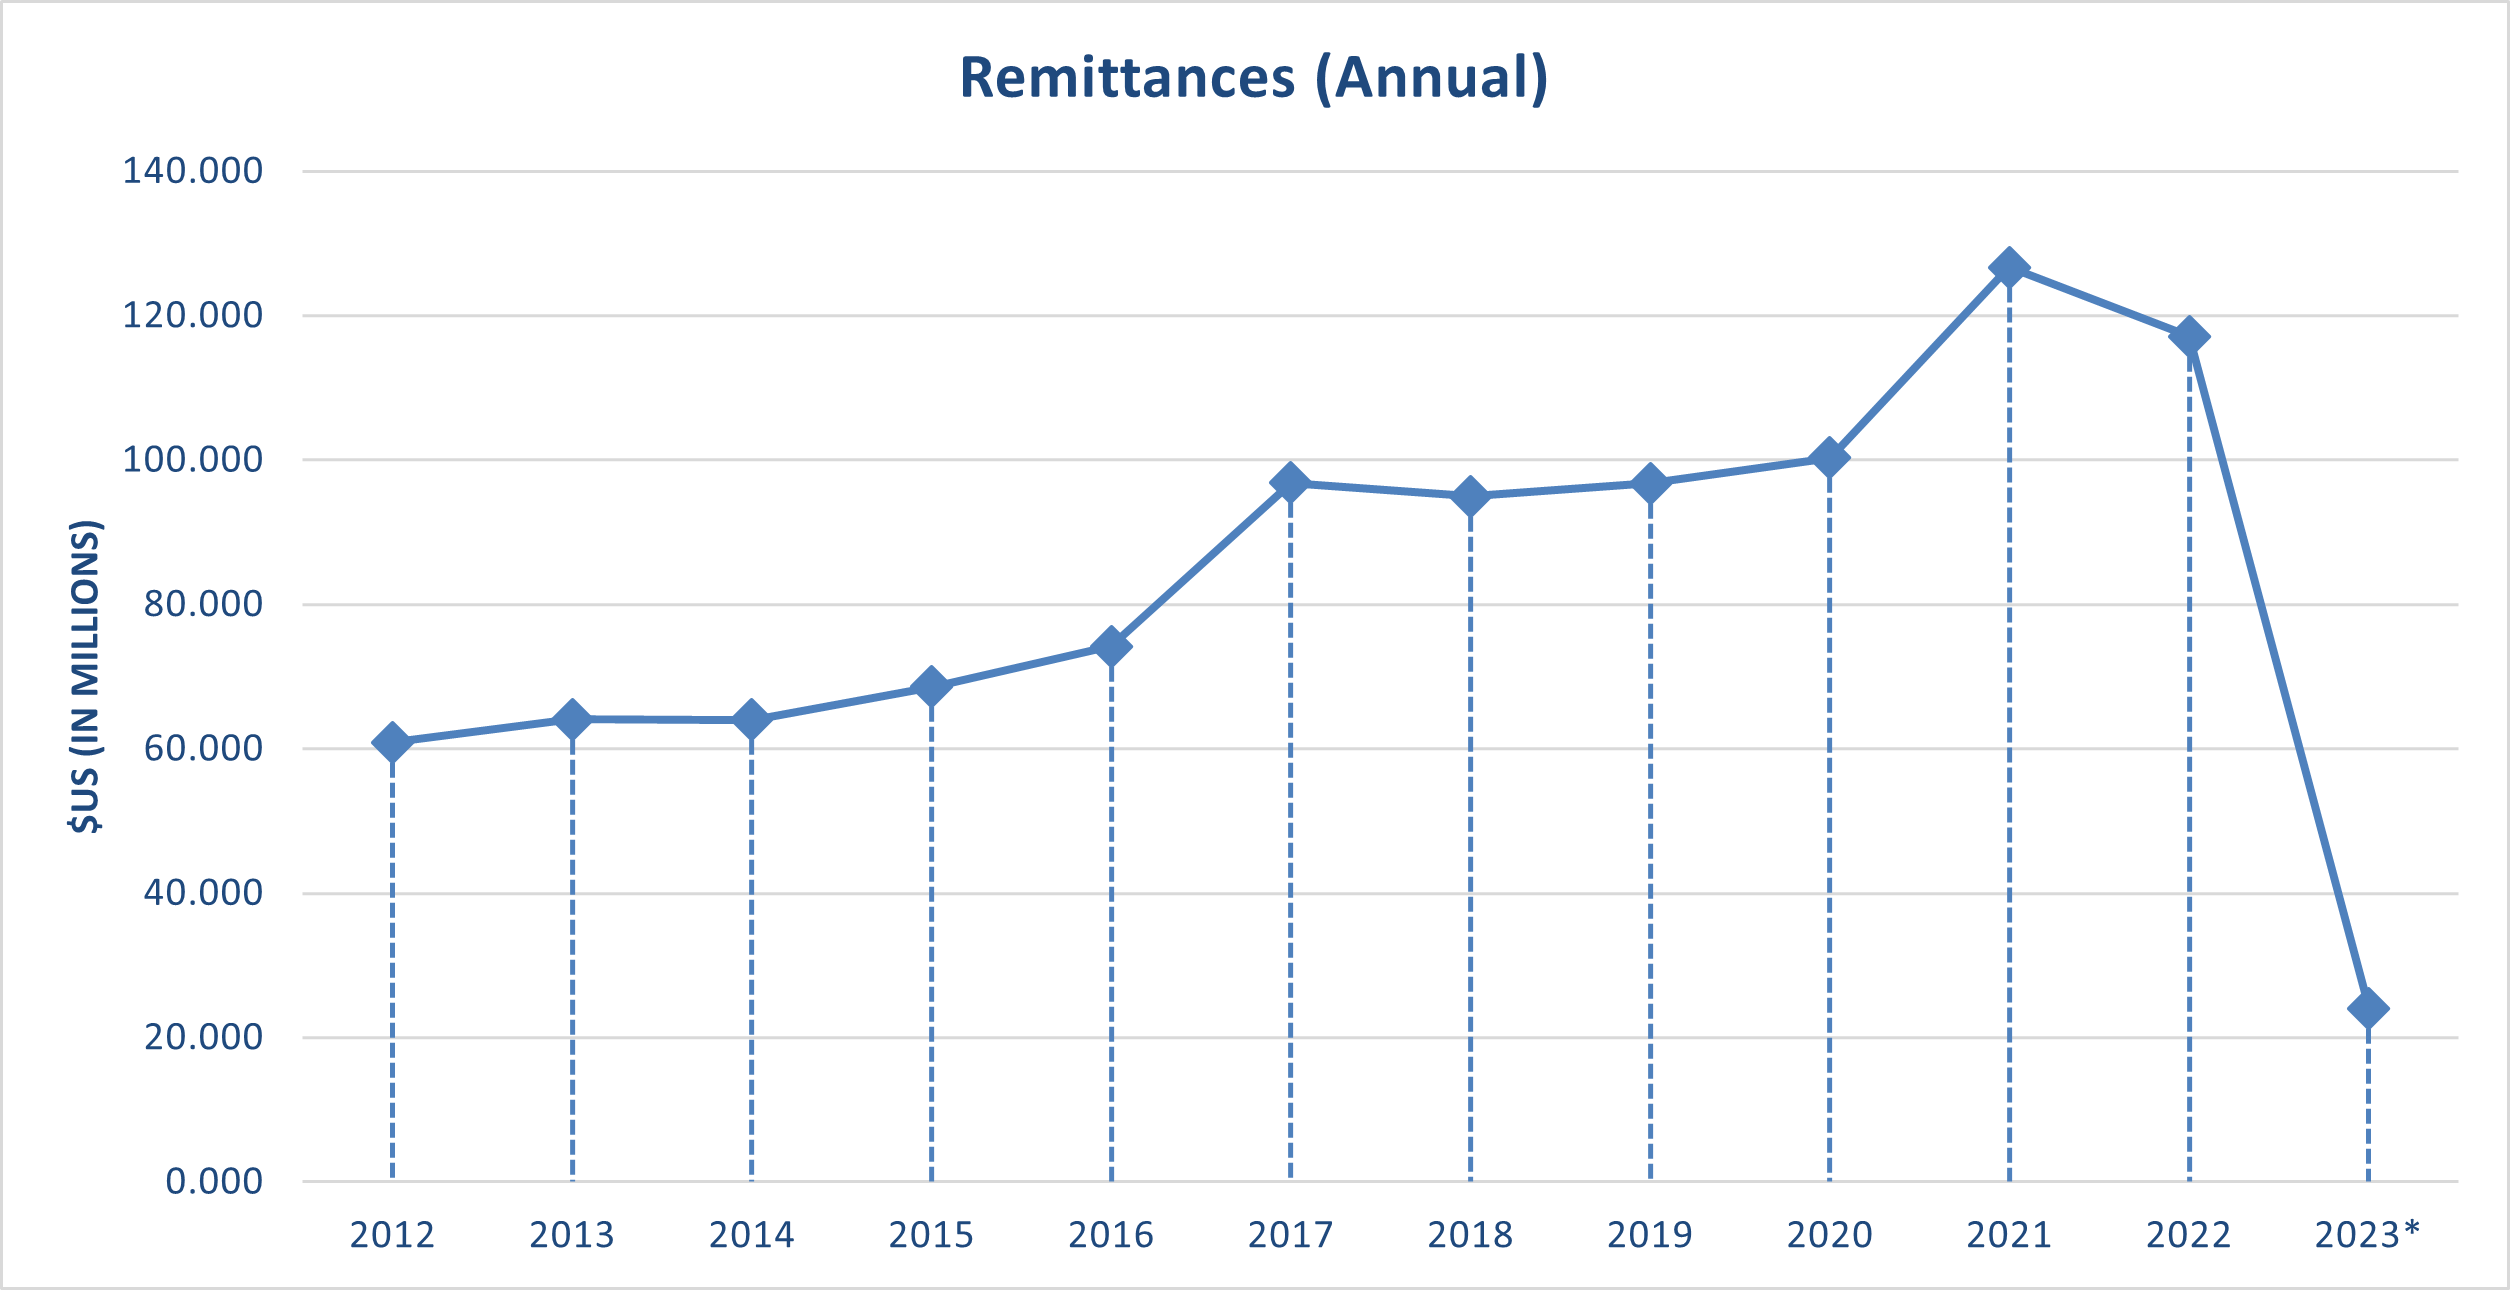
EI Remittance (Annual)
Annual Remittance Economic Indicator
Units of Measure= $USD (Millions)
Source: Banking Section, Department of Commerce; Values are rounded to the nearest Hundredth
| Remittances (US $ Millions) |
% Change to Previous Year | |
|---|---|---|
| Source: CNMI Economic Indicators / CSD | ||
| 2023* | $24.03 | -79.48% |
| 2022 | $117.13 | -7.54% |
| 2021 | $126.69 | 26.34% |
| 2020 | $100.28 | 3.64% |
| 2019 | $96.76 | 1.87% |
| 2018 | $94.98 | -1.90% |
| 2017 | $96.82 | 30.54% |
| 2016 | $74.17 | 8.17% |
| 2015 | $68.57 | 7.16% |
| 2014 | $63.99 | -0.17% |
| 2013 | $64.10 | 5.25% |
| 2012 | $60.90 | -0.33% |
| 2011 | $61.10 | -7.78% |
| 2010 | $66.25 | 2.32% |
| 2009 | $64.75 | -15.66% |
| 2008 | $76.77 | -17.98% |
| 2007 | $93.60 | -8.41% |
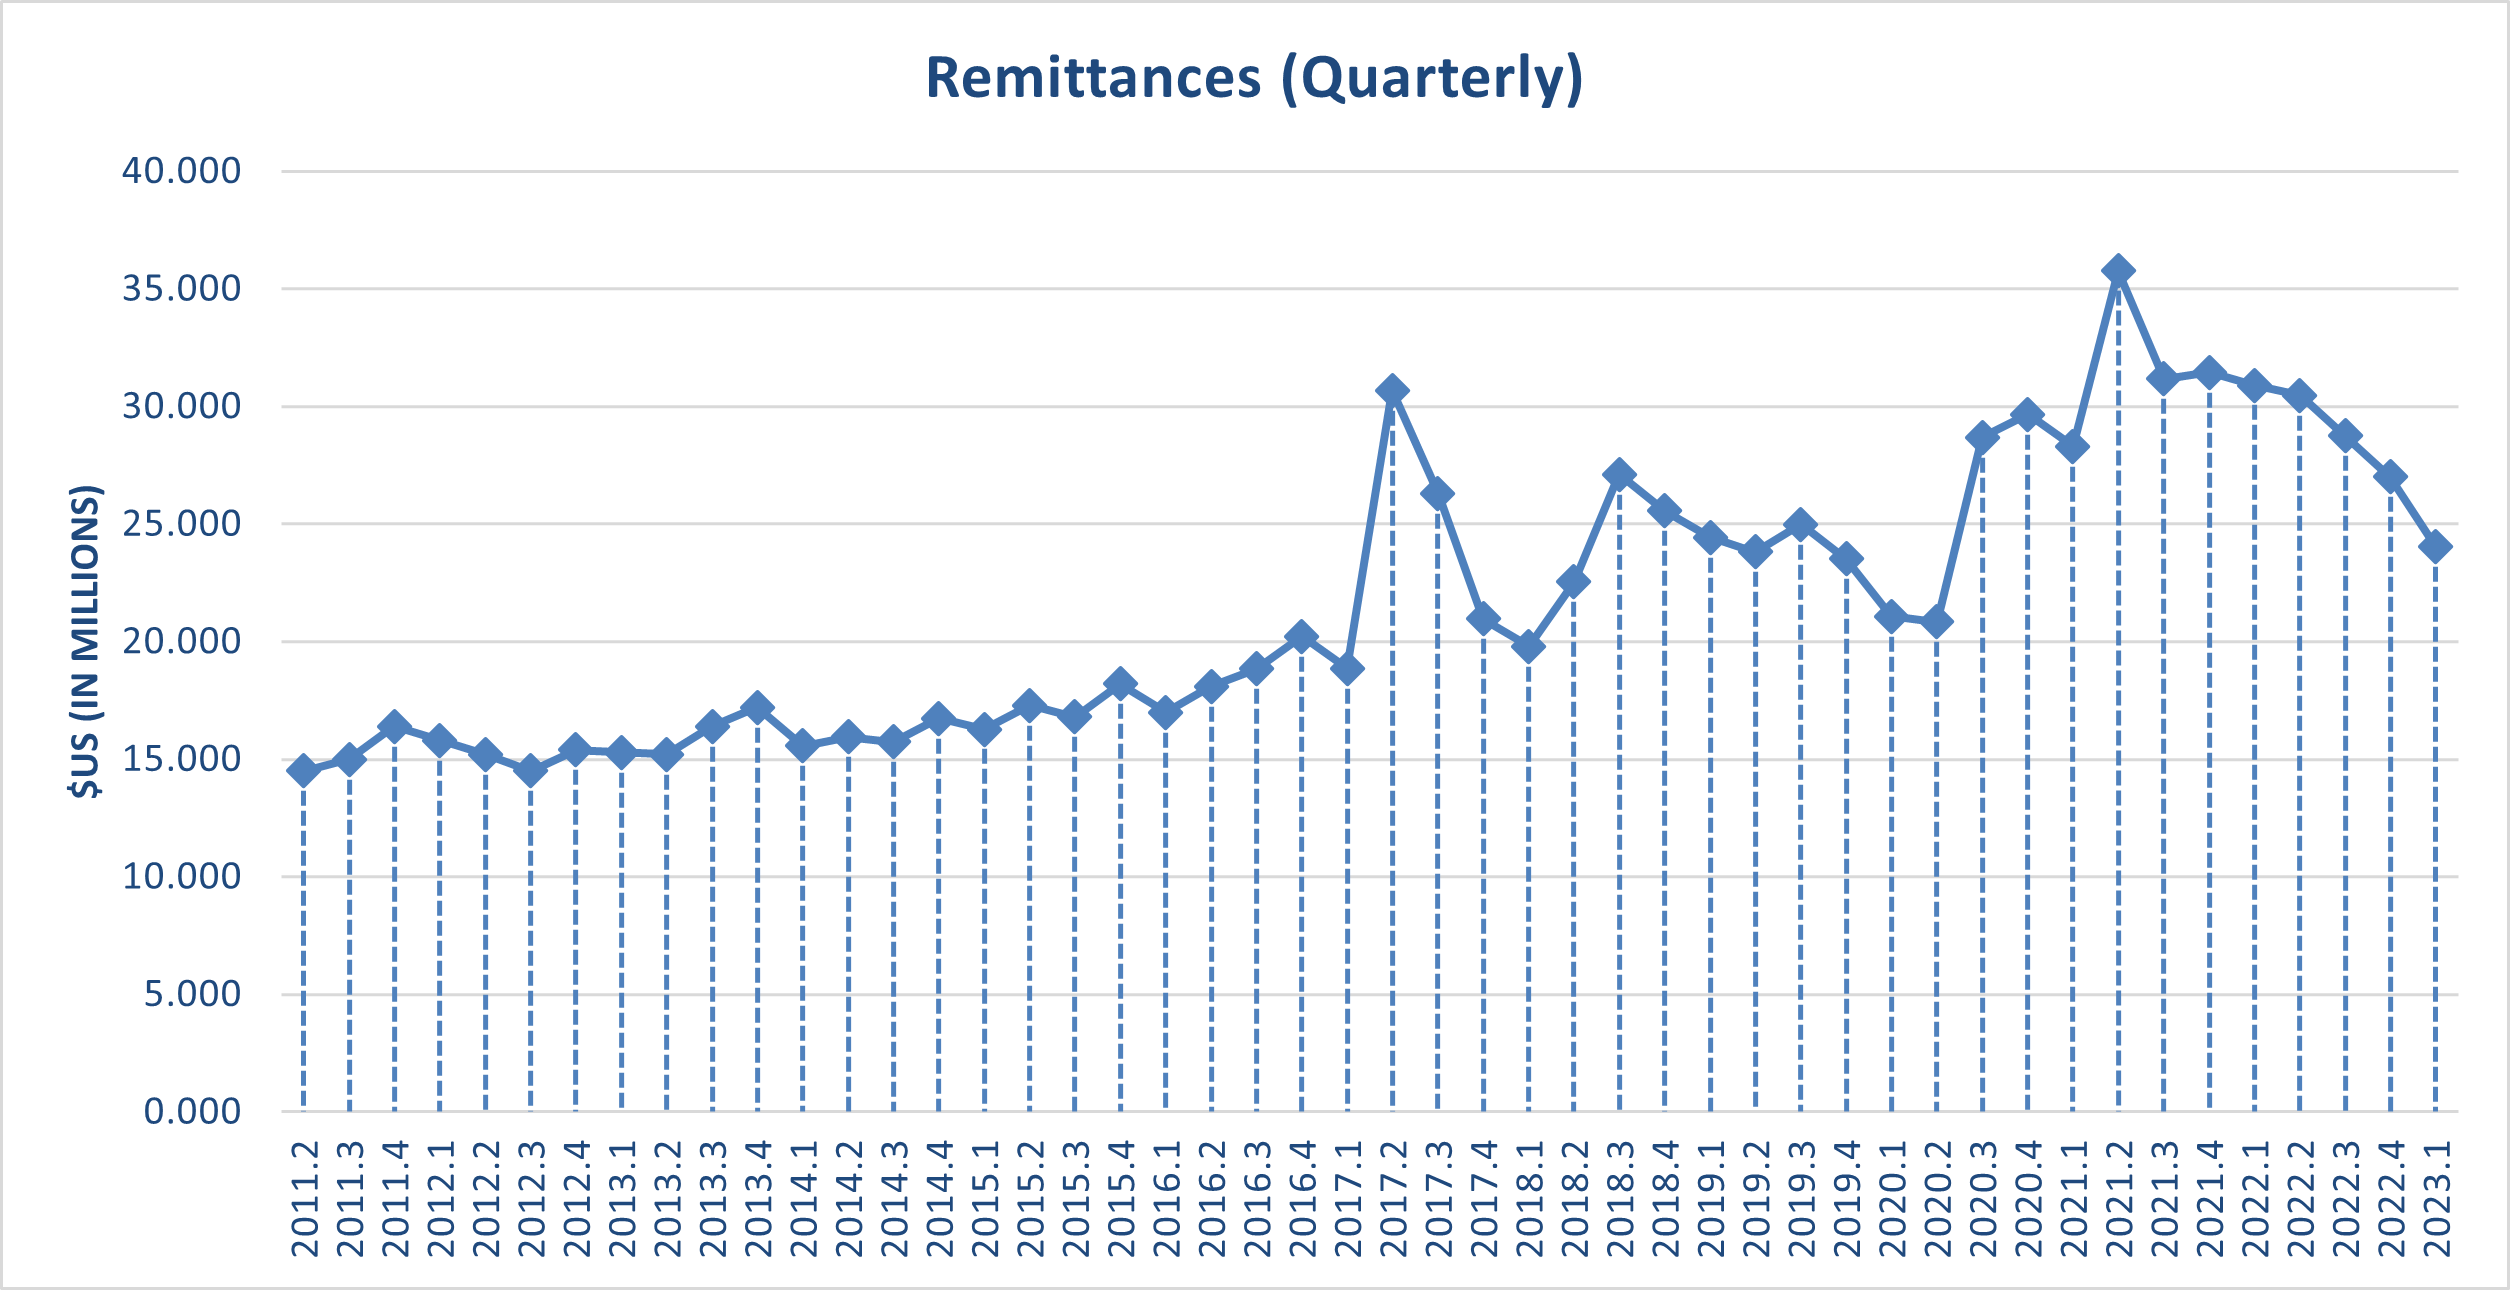
EI Remittance (Quarterly)
Quarterly Remittance Economic Indicator
Units of Measure= $USD (Millions)
Source: Banking Section, Department of Commerce; Values are rounded to the nearest Hundredth
| Remittances (US $ Millions) |
% Change to Previous Quarter | |
|---|---|---|
| Source: CNMI Economic Indicator / CSD | ||
| 2023.1 | $24.03 | -11.00% |
| 2022.4 | $27.00 | -6.07% |
| 2022.3 | $28.75 | -5.67% |
| 2022.2 | $30.47 | -1.41% |
| 2022.1 | $30.91 | -1.74% |
| 2021.4 | $31.46 | 0.91% |
| 2021.3 | $31.18 | -12.82% |
| 2021.2 | $35.76 | 26.37% |
| 2021.1 | $28.30 | -4.58% |
| 2020.4 | $29.66 | 3.35% |
| 2020.3 | $28.69 | 37.65% |
| 2020.2 | $20.85 | -1.12% |
| 2020.1 | $21.08 | -10.40% |
| 2019.4 | $23.53 | -5.80% |
| 2019.3 | $24.98 | 4.88% |
| 2019.2 | $23.82 | -2.53% |
| 2019.1 | $24.43 | -4.38% |
| 2018.4 | $25.55 | -5.73% |
| 2018.3 | $27.11 | 20.29% |
| 2018.2 | $22.54 | 13.89% |
| 2018.1 | $19.79 | -5.64% |
| 2017.4 | $20.97 | -20.29% |
| 2017.3 | $26.31 | -14.24% |
| 2017.2 | $30.68 | 62.67% |
| 2017.1 | $18.86 | -6.77% |
| 2016.4 | $20.23 | 7.32% |
| 2016.3 | $18.85 | 4.14% |
| 2016.2 | $18.10 | 6.53% |
| 2016.1 | $16.99 | -6.70% |
| 2015.4 | $18.21 | 8.39% |
| 2015.3 | $16.80 | -2.78% |
| 2015.2 | $17.28 | 6.14% |
| 2015.1 | $16.28 | -2.75% |
| 2014.4 | $16.74 | 6.35% |
| 2014.3 | $15.74 | -1.32% |
| 2014.2 | $15.95 | 2.51% |
| 2014.1 | $15.56 | -9.53% |
| 2013.4 | $17.20 | 4.88% |
| 2013.3 | $16.40 | 7.89% |
| 2013.2 | $15.20 | -0.65% |
| 2013.1 | $15.30 | -0.65% |
| 2012.4 | $15.40 | 6.21% |
| 2012.3 | $14.50 | -4.61% |
| 2012.2 | $15.20 | -3.80% |
| 2012.1 | $15.80 | -3.66% |
| 2011.4 | $16.40 | 9.33% |
| 2011.3 | $15.00 | 3.45% |
| 2011.2 | $14.50 | -4.61% |
| 2011.1 | $15.20 | -7.62% |
| 2010.4 | $16.45 | -5.44% |
| 2010.3 | $17.40 | 8.07% |
| 2010.2 | $16.10 | -1.23% |
| 2010.1 | $16.30 | -1.81% |
| 2009.4 | $16.60 | 4.40% |
| 2009.3 | $15.90 | -1.86% |
| 2009.2 | $16.20 | 0.95% |
| 2009.1 | $16.05 | -6.51% |
| 2008.4 | $17.17 | -9.93% |
| 2008.3 | $19.06 | -3.32% |
| 2008.2 | $19.71 | -5.41% |
| 2008.1 | $20.84 | -14.18% |
| 2007.4 | $24.28 | 10.88% |
| 2007.3 | $21.90 | -0.38% |
| 2007.2 | $21.98 | -13.59% |
| 2007.1 | $25.44 | -7.82% |
Economic Indicator
To download, right click on the chart and select “Save Image As”…