DescriptionTable DataChart and Figure Data
HIES 2016
HIES 2016
HIES 2016 Table 1. Selected Population Characteristics by District and Island, CNMI: 2016
Household Income and Expenditures Survey 2016 CNMI CSD
Note: Sorting not available due to the table concept
| Characteristic | CNMI | Saipan Total |
Saipan District 1 |
Saipan District 2 |
Saipan District 3 |
Saipan District 4 |
Saipan District 5 |
Tinian District 6 |
Rota District 7 |
|---|---|---|---|---|---|---|---|---|---|
| Source: 2016 CNMI Household Income and Expenditures Survey | |||||||||
| Males | 27,713 | 24,703 | 7,669 | 3,092 | 8,473 | 1,607 | 3,861 | 1,666 | 1,345 |
| Females | 26,177 | 23,497 | 7,495 | 2,952 | 7,372 | 1,572 | 4,105 | 1,390 | 1,290 |
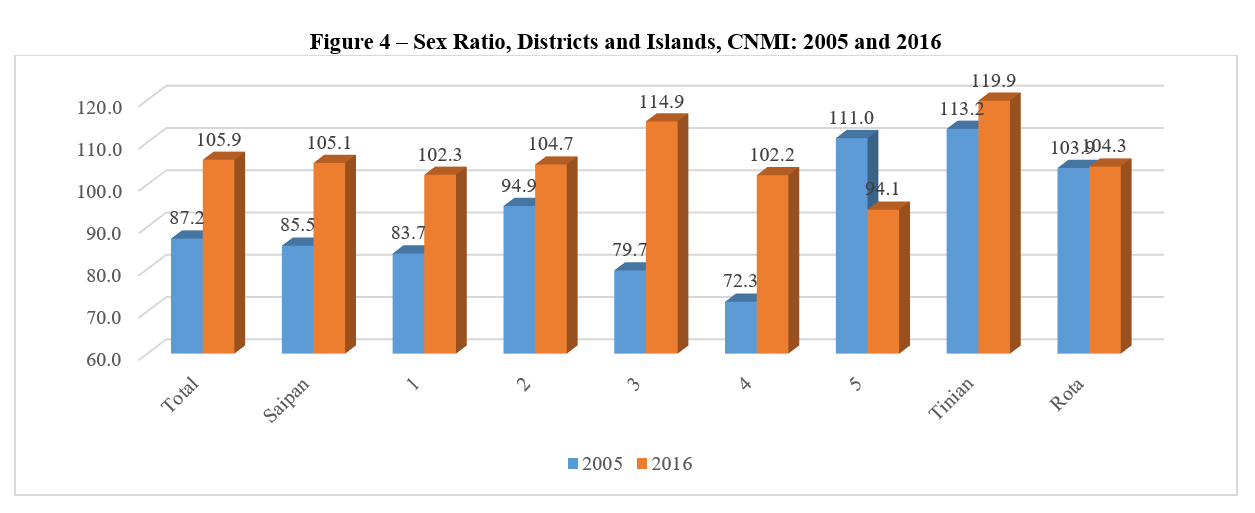
| Sex ratio | 105.9 | 105.1 | 102.3 | 104.7 | 114.9 | 102.2 | 94.1 | 119.9 | 104.3 |
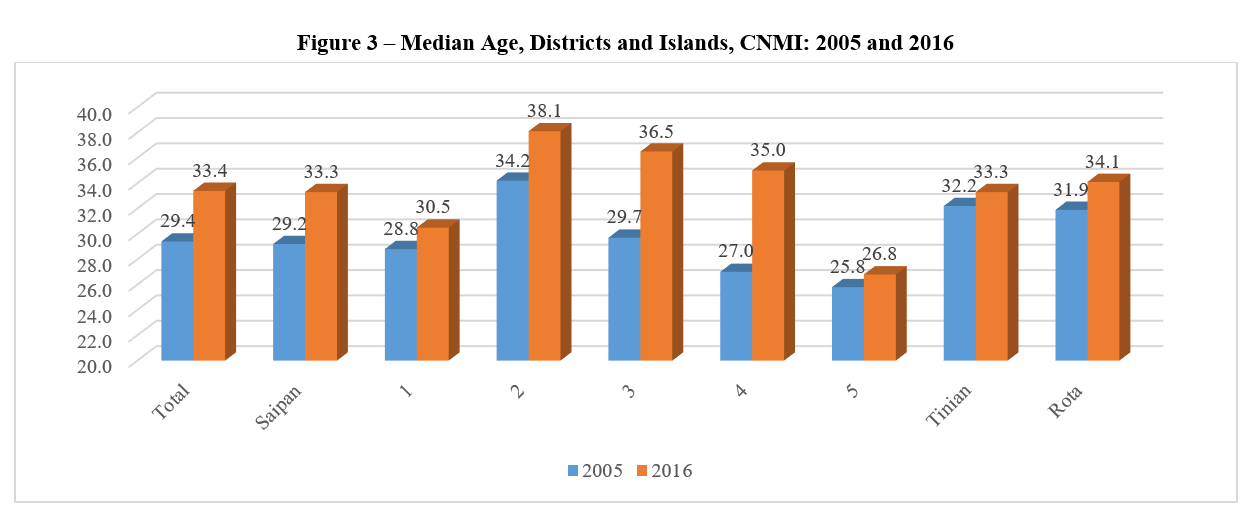
| Median Age | 33.4 | 33.3 | 30.5 | 38.1 | 36.5 | 35.0 | 26.8 | 33.3 | 34.1 |
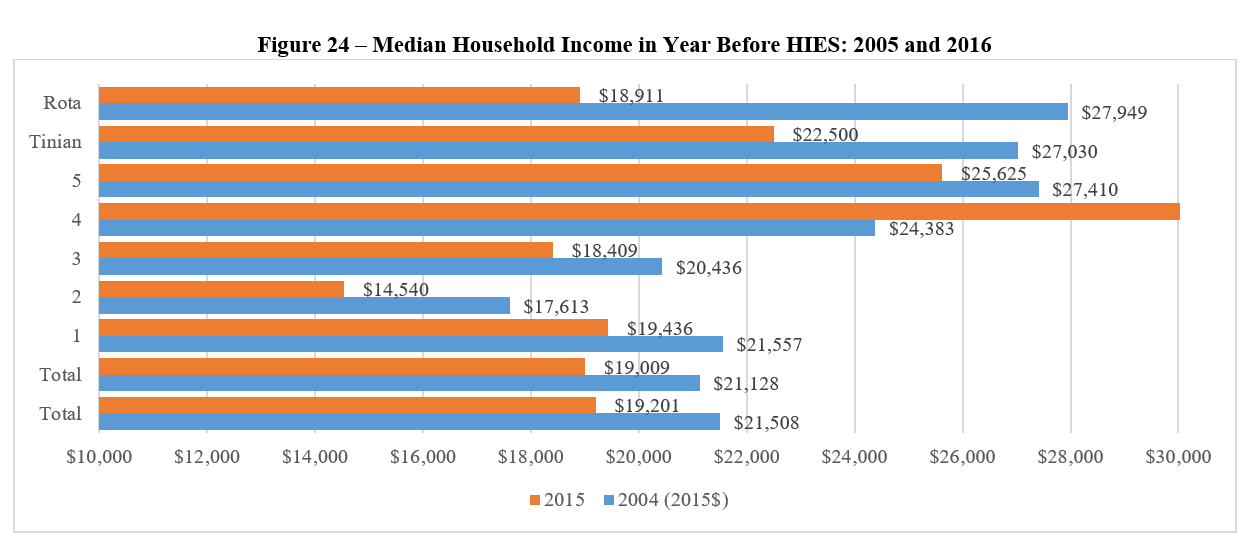
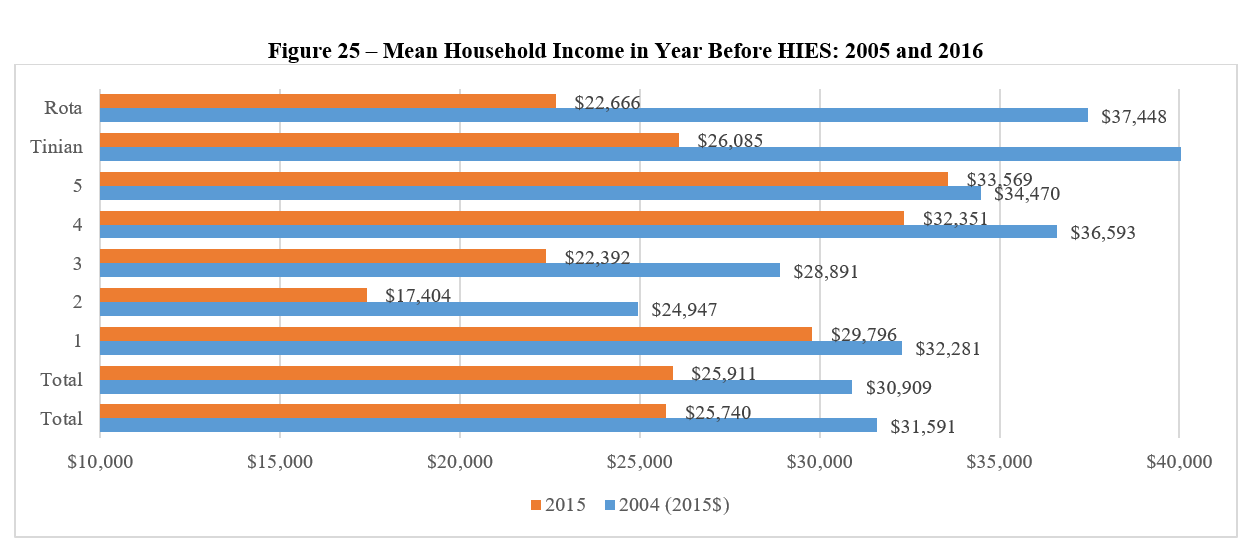
| Median Household Income | $19,201 | $19,009 | $19,436 | $14,540 | $18,409 | $30,769 | $25,625 | $22,500 | $18,911 |
HIES 2016 Table 1. Percentages of Characteristics by District and Island, CNMI: 2016
Household Income and Expenditures Survey 2016 CNMI CSD
| Characteristic | CNMI | Saipan Total |
Saipan District 1 |
Saipan District 2 |
Saipan District 3 |
Saipan District 4 |
Saipan District 5 |
Tinian District 6 |
Rota District 7 |
|---|---|---|---|---|---|---|---|---|---|
| Source: 2016 CNMI Household Income and Expenditures Survey | |||||||||
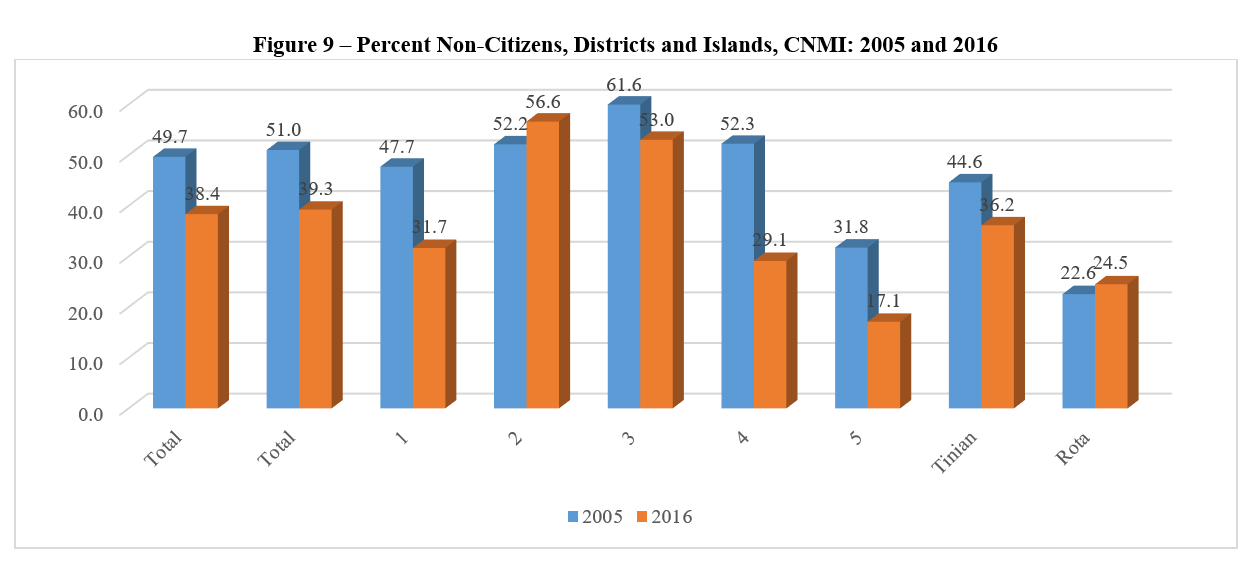
| Chamorro ethnicity | 26.8% | 24.6% | 30.9% | 8.4% | 9.0% | 46.1% | 47.6% | 36.7% | 54.4% |
| Filipino ethnicity | 44.9% | 45.2% | 36.3% | 65.3% | 61.2% | 29.1% | 21.5% | 47.1% | 36.1% |
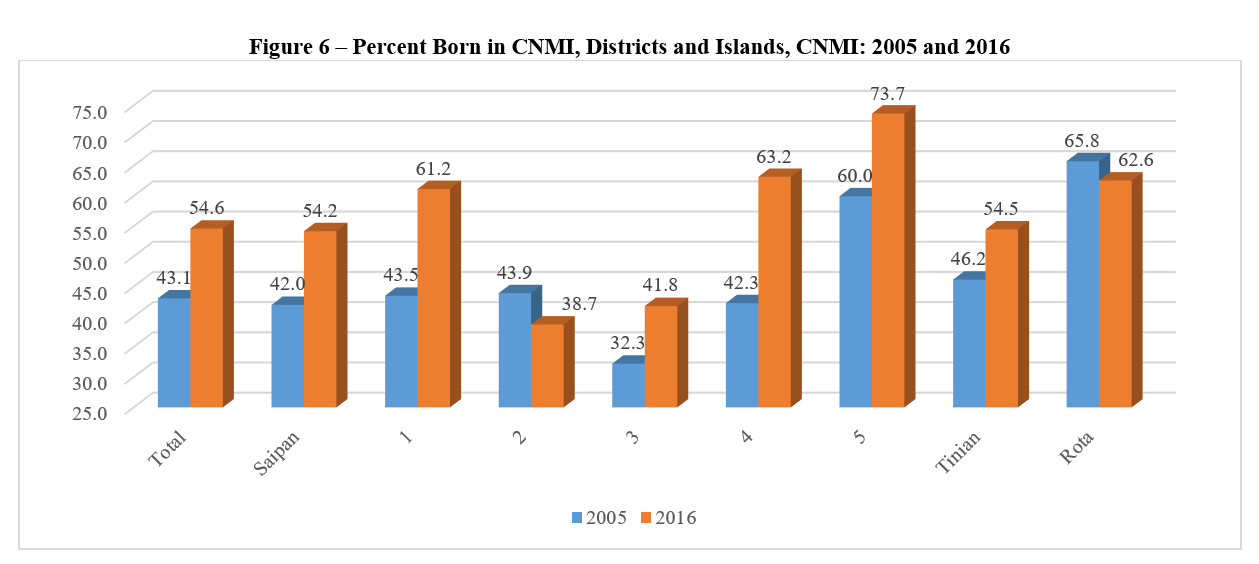
| Born in CNMI | 54.6% | 54.2% | 61.2% | 38.7% | 41.8% | 63.2% | 73.7% | 54.5% | 62.6% |
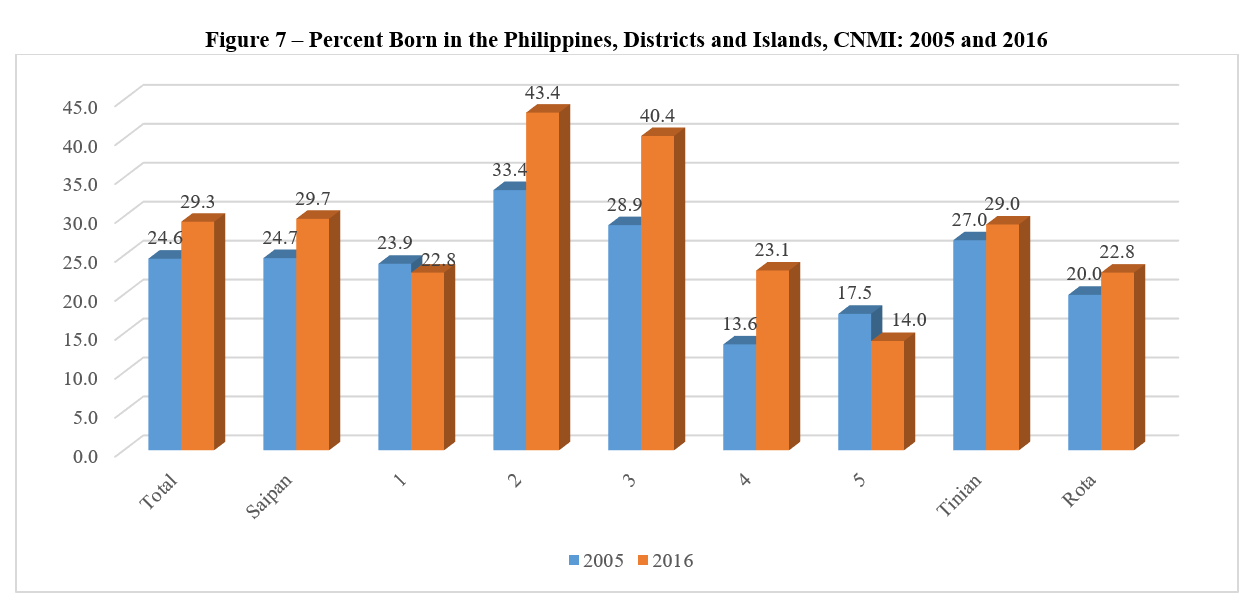
| Born in the Philippines | 29.3% | 29.7% | 22.8% | 43.4% | 40.4% | 23.1% | 14.0% | 29.0% | 22.8% |
| U.S. Citizen | 61.6% | 60.7% | 68.3% | 43.4% | 47.0% | 70.9% | 82.9% | 63.8% | 75.5% |
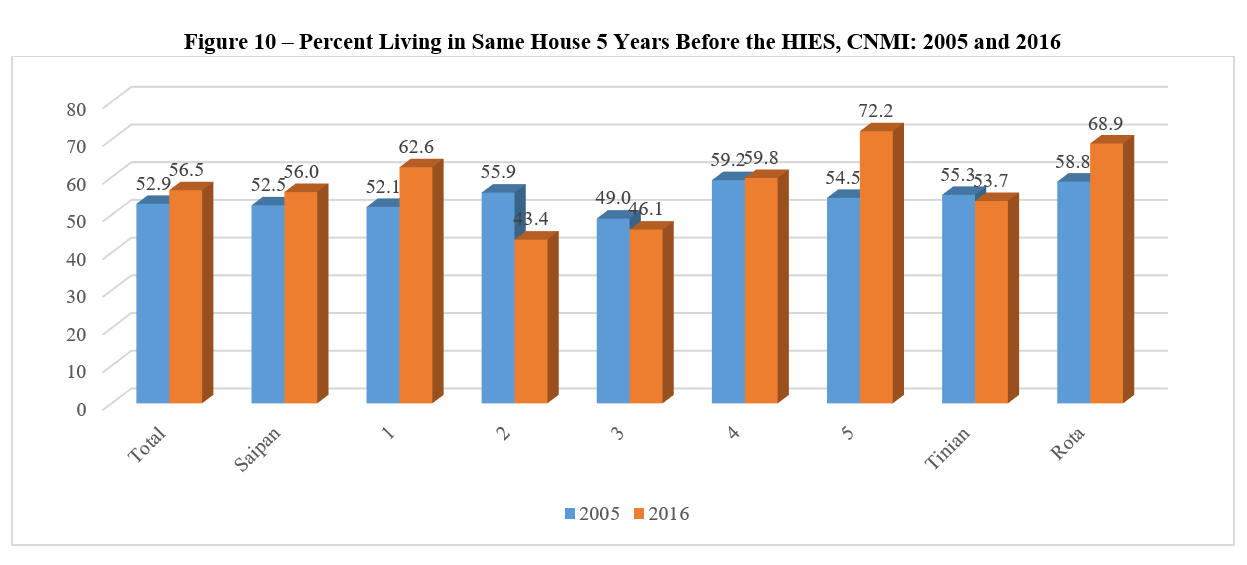
| Living in same unit in 2011 | 56.5% | 56.0% | 62.6% | 43.4% | 46.1% | 59.8% | 72.2% | 53.7% | 68.9% |
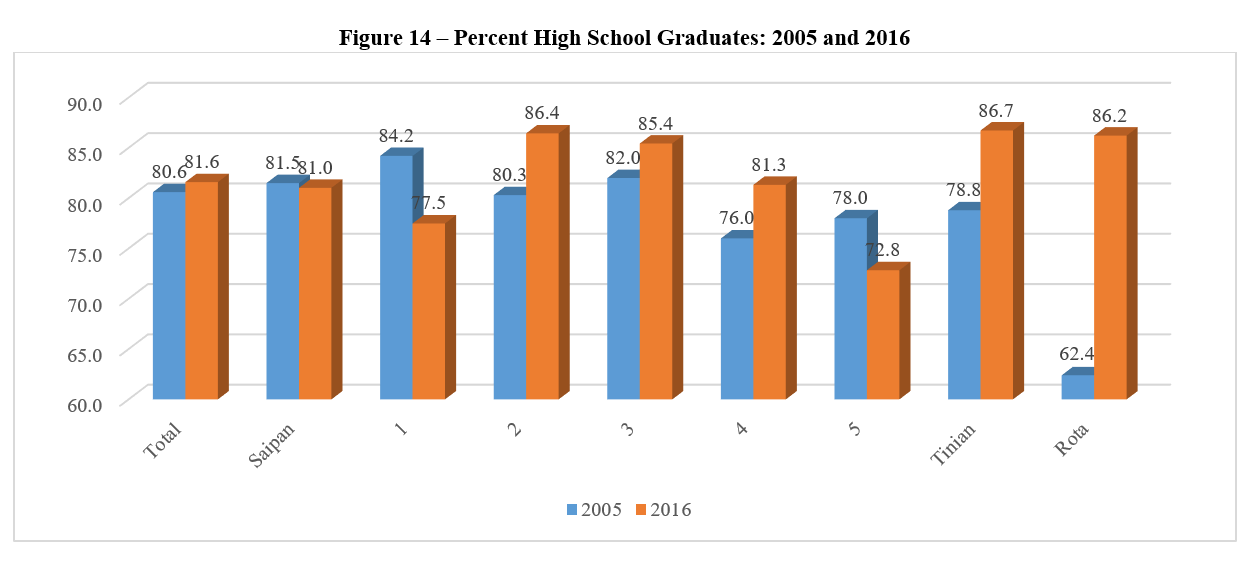
| Percent High School Graduate | 81.6% | 81.0% | 77.5% | 86.4% | 85.4% | 81.3% | 72.8% | 86.7% | 86.2% |
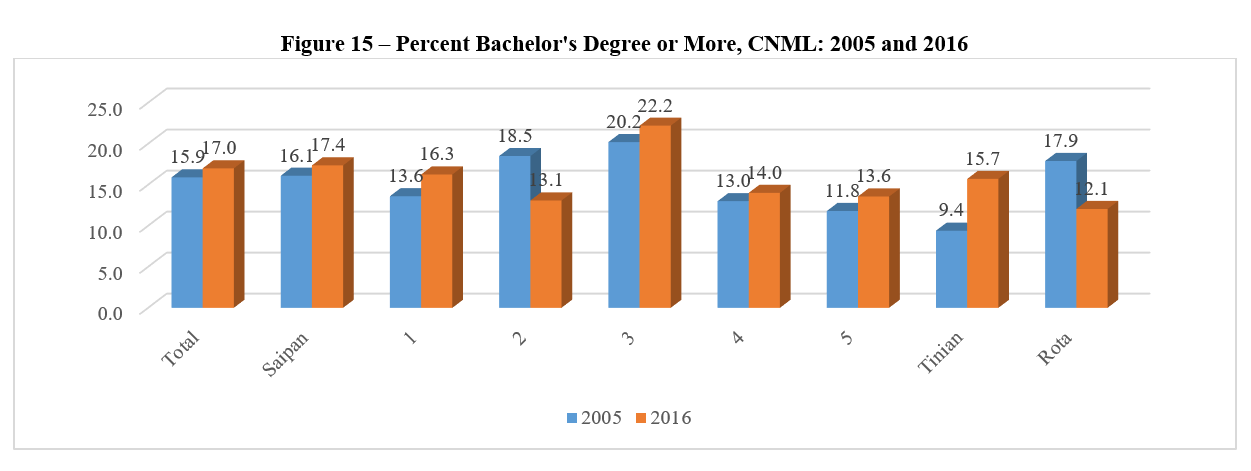
| Percent BA/BS or more | 17.0% | 17.4% | 16.3% | 13.1% | 22.2% | 14.0% | 13.6% | 15.7% | 12.1% |
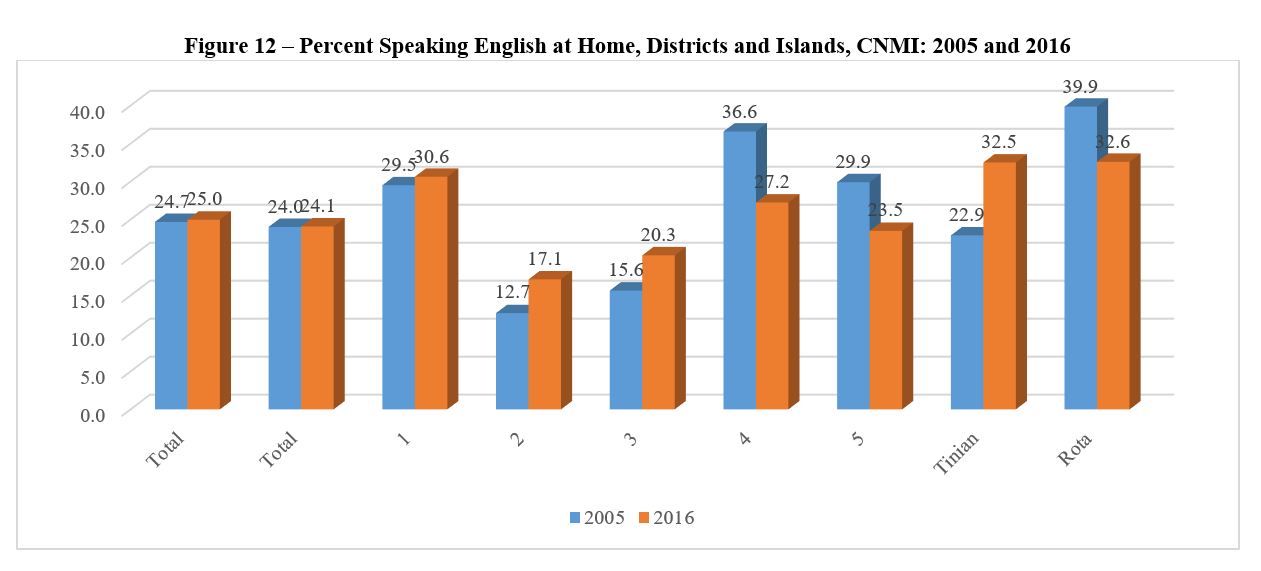
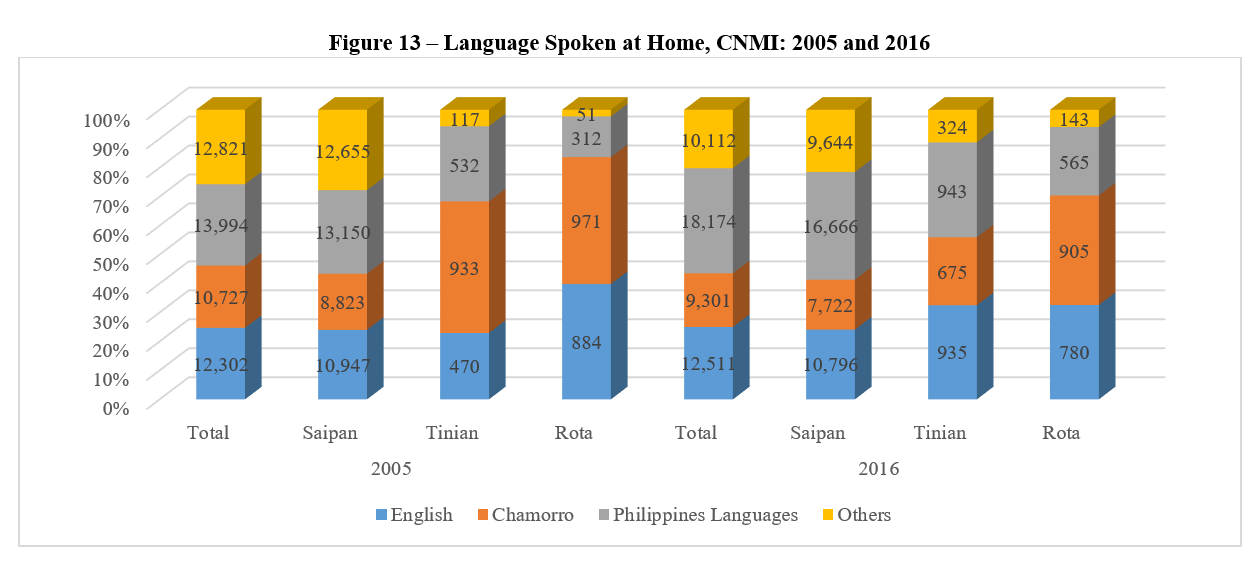
| Speaking only English | 25.0% | 24.1% | 30.6% | 17.1% | 20.3% | 27.2% | 23.5% | 32.5% | 32.6% |
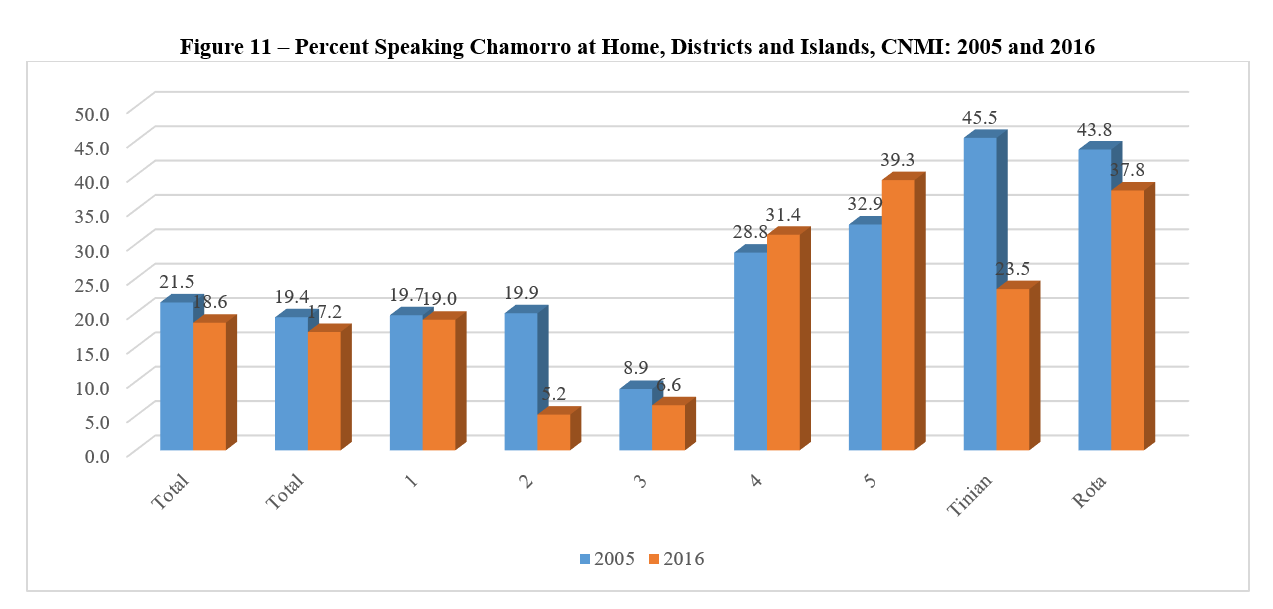
| Speaking Chamorro | 18.6% | 17.2% | 19.0% | 5.2% | 6.6% | 31.4% | 39.3% | 23.5% | 37.8% |
| Speaking Filipino language | 36.3% | 37.2% | 30.1% | 54.1% | 49.7% | 27.8% | 15.6% | 32.8% | 23.6% |
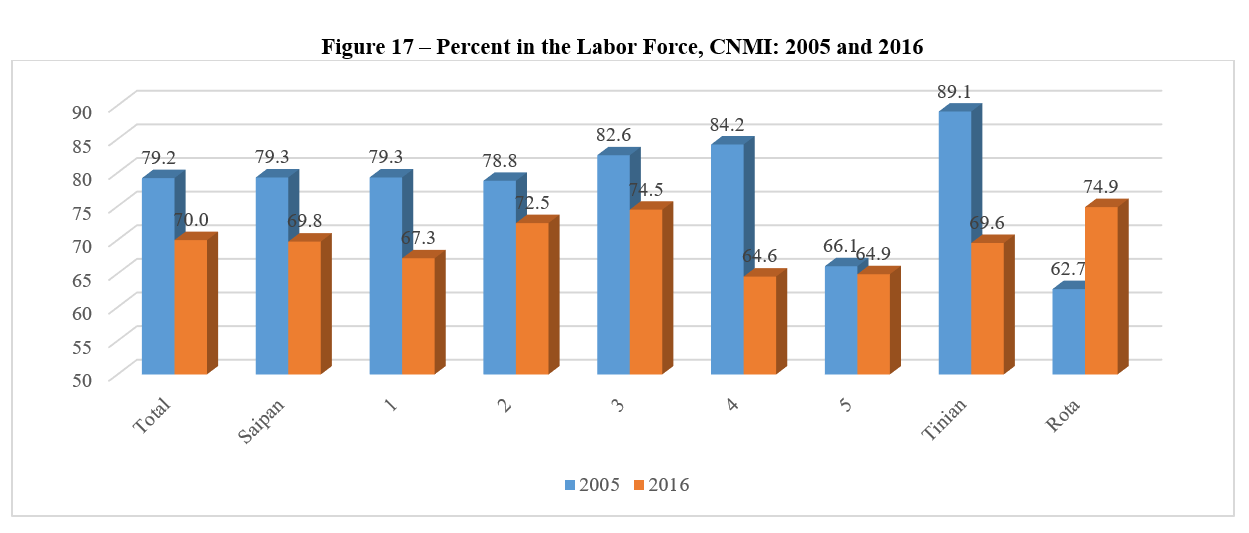
| In the labor force | 70.0% | 69.8% | 67.3% | 72.5% | 74.5% | 64.6% | 64.9% | 69.6% | 74.9% |
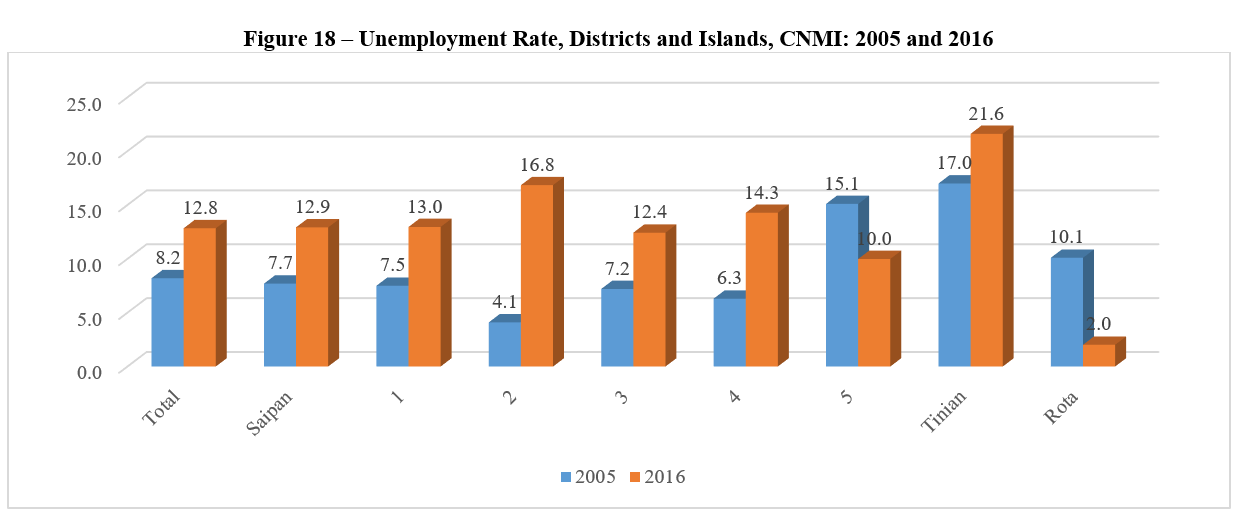
| Unemployed | 12.8% | 12.9% | 13.0% | 16.8% | 12.4% | 14.3% | 10.0% | 21.6% | 2.0% |
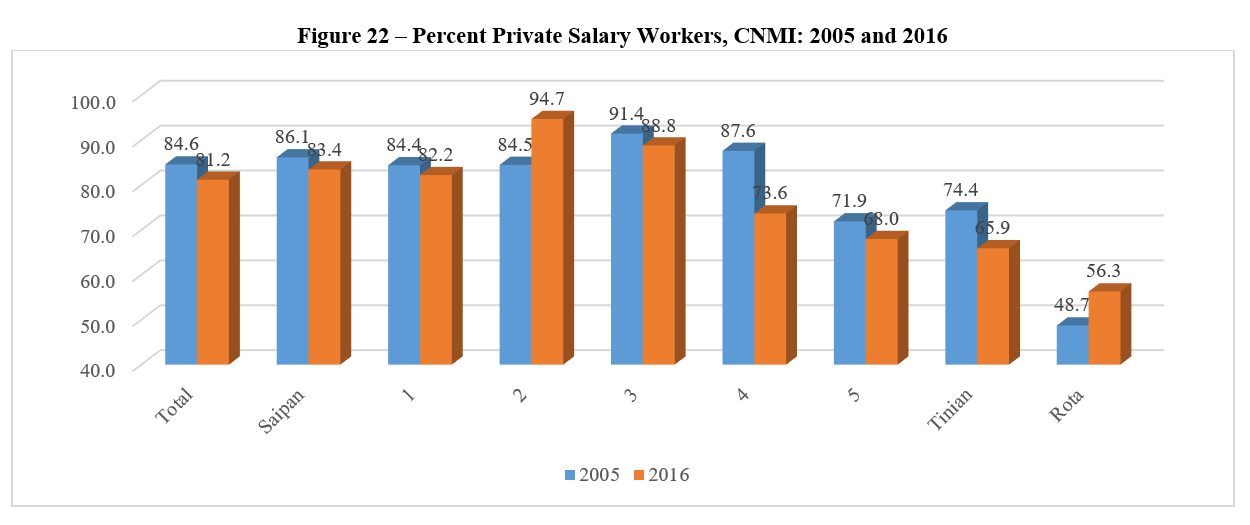
| Working for Private company | 81.2% | 83.4% | 82.2% | 94.7% | 88.8% | 73.6% | 68.0% | 65.9% | 56.3% |
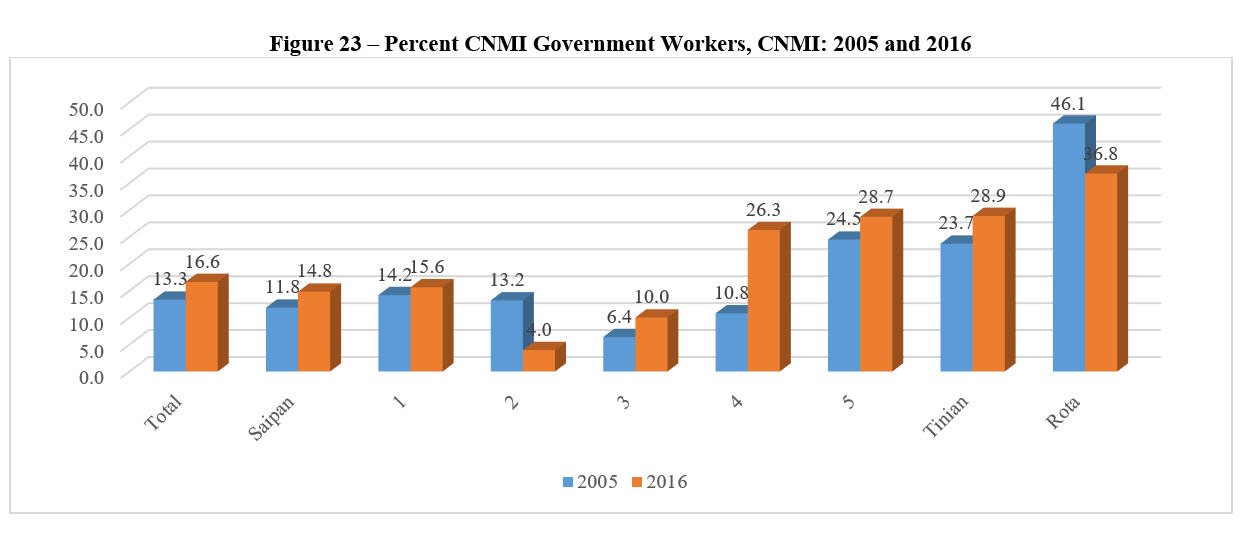
| Working for CNMI government | 16.6% | 14.8% | 15.6% | 4.0% | 10.0% | 26.3% | 28.7% | 28.9% | 36.8% |
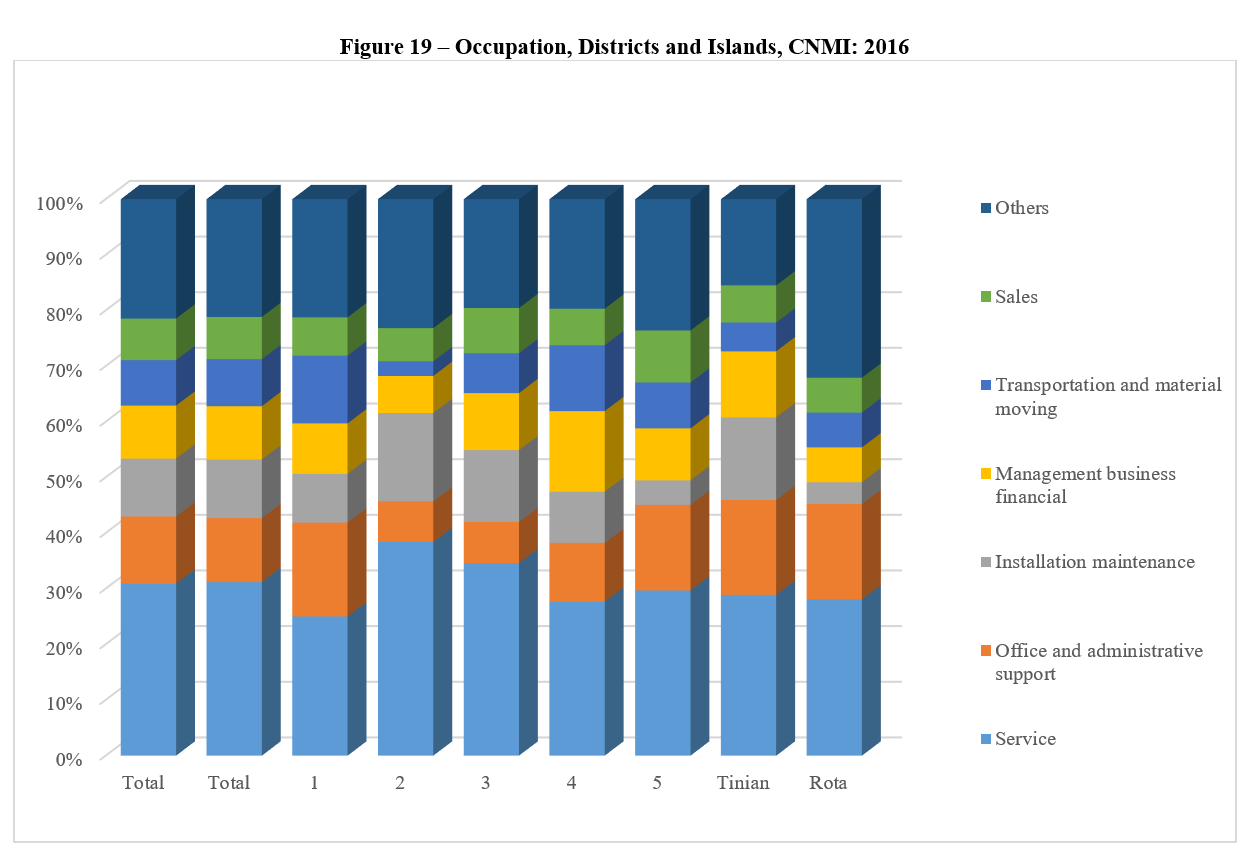
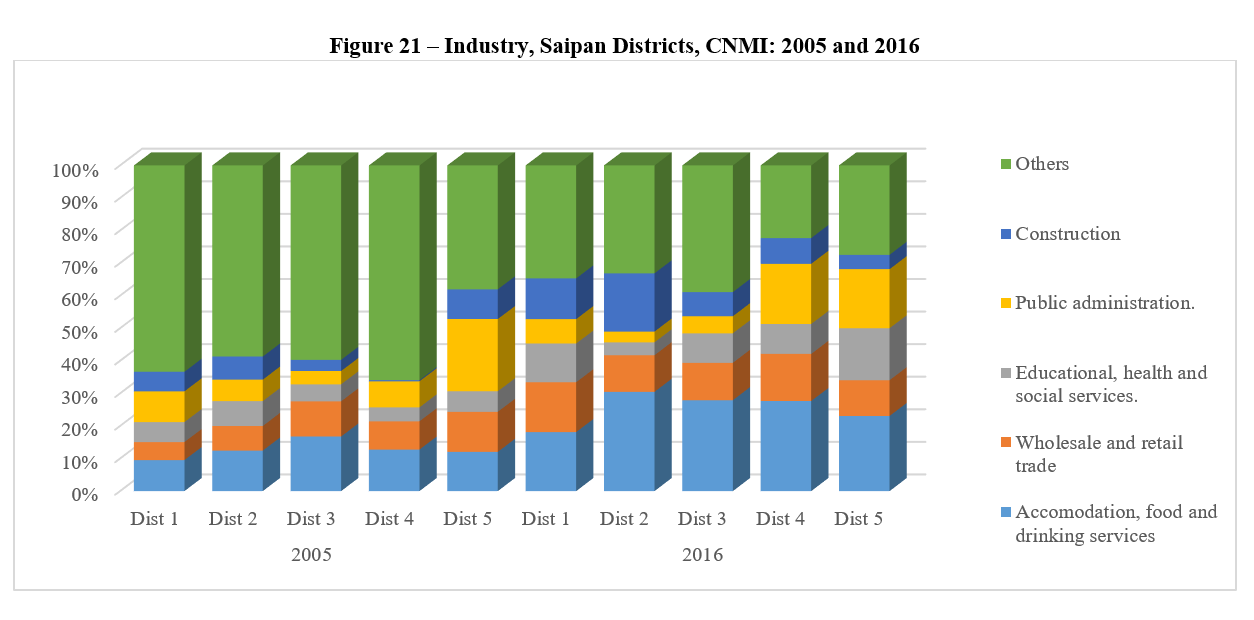
| Service occupations | 30.9% | 31.2% | 25.0% | 38.4% | 34.6% | 27.6% | 29.7% | 28.9% | 28.1% |
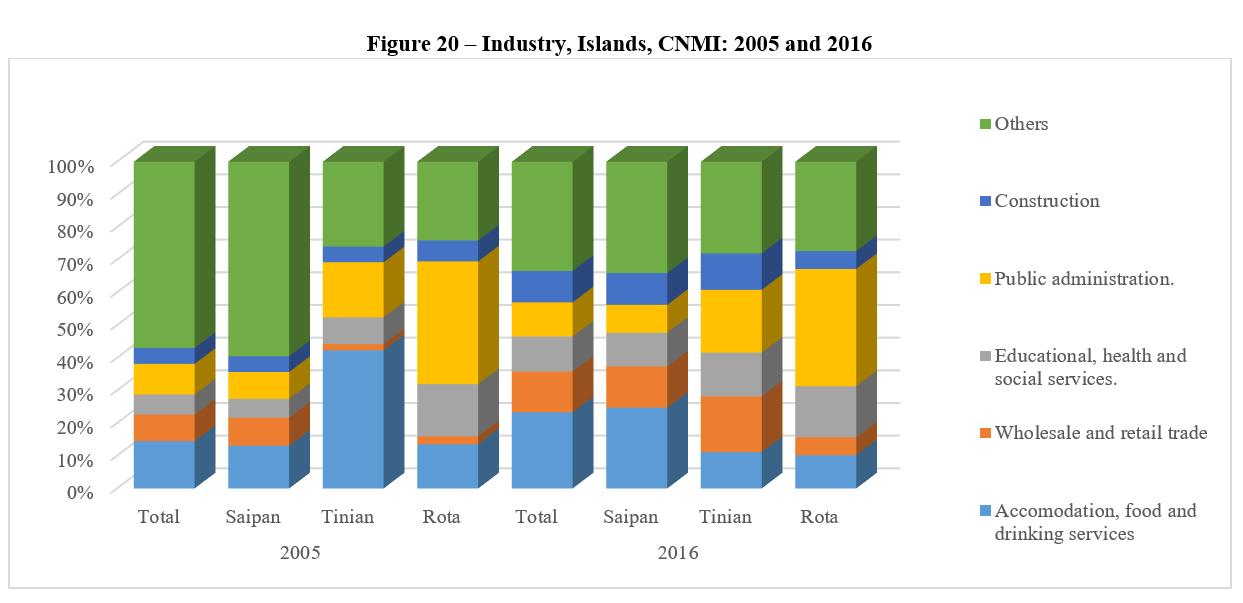
| Hotel and food industry | 23.3% | 24.7% | 18.1% | 30.5% | 27.9% | 27.6% | 23.1% | 11.1% | 10.2% |
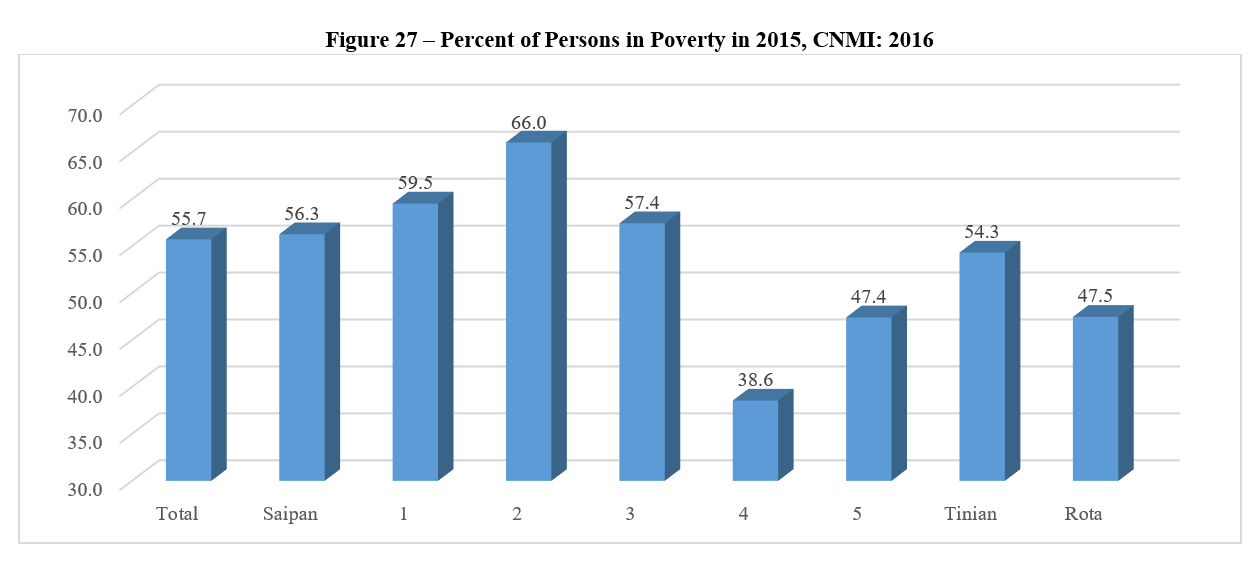
| Persons in Poverty | 55.7% | 56.3% | 59.5% | 66.0% | 57.4% | 38.6% | 47.4% | 54.3% | 47.5% |
HIES 2016
To download, right click on the chart and select “Save Image As”…
