LFP HOUSING CHARACTERISTICS BY BUILDING TYPE
CNMI Total
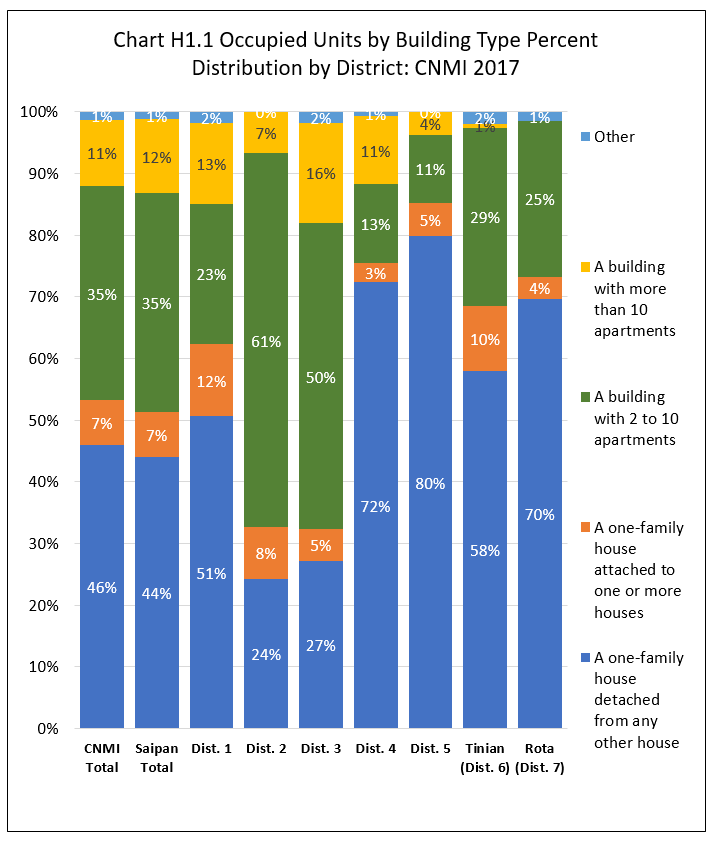
One-family house detached from any other house was 45.9% of all occupied housing units in the CNMI in 2017. Units in a building with 2 to 10 apartments was 34.7%; unit in a building with more than 10 apartment units was 10.8%; one-family house attached to one or more houses was 7.4%, other types of units was 1.3%.
By Island
In Saipan, one-family house detached from any other house was 44.0% of all occupied housing units; unit in a building with 2 to 10 apartments was 35.5%; unit in a building with more than 10 apartment units was 12.0%; one-family house attached to one or more houses was 7.4%; while other building types was 1.2%. Single-family house detached from any other house percentage was higher in Rota (69.6%) and Tinian (58.0%). In other words, Saipan has relatively more apartment-type units while Rota and Tinian had relatively more single-family type units. Almost all buildings in the CNMI with more than 10 apartment units (99.7%) were in Saipan.
By Saipan Districts
Within Saipan, single-family house detached from any other house percentage was higher in Districts 5 (79.8%) and 4 (72.4%) and relatively lower in Districts 2 (24.3%) and 3 (27.2%) and was just over half in District 1 (50.6%). See Table H.1.0 and Chart H.1.1 for detail.
Housing Characteristics
LFS 2017 Table H1.1
Labor Force Participation Measures
Table H1.1 Occupied Housing Units by Building Type, by Island, and by District: CNMI, 2017 4th Qtr.
| Saipan District 1 |
Saipan District 2 |
Saipan District 3 |
Saipan District 4 |
Saipan District 5 |
Tinian District 6 |
Rota District 7 |
||
|---|---|---|---|---|---|---|---|---|
| Source: Labor Force Survey CNMI, 2017 4th Qtr. | ||||||||
| Housing Unit | A one-family house detached from any other house | 2,193 | 497 | 1,502 | 812 | 1,611 | 522 | 532 |
| Housing Unit | A one-family house attached to one or more houses | 508 | 173 | 282 | 35 | 110 | 94 | 28 |
| Housing Unit | A building with 2 to 10 apartments | 987 | 1,243 | 2,742 | 143 | 223 | 260 | 193 |
| Housing Unit | A building with more than 10 apartments | 566 | 138 | 898 | 123 | 74 | 6 | – |
| Housing Unit | Other | 78 | – | 98 | 8 | – | 17 | 11 |
| Percent within | A one-family house detached from any other house | 50.60% | 24.30% | 27.20% | 72.40% | 79.80% | 58.00% | 69.60% |
| Percent within | A one-family house attached to one or more houses | 11.70% | 8.40% | 5.10% | 3.20% | 5.50% | 10.50% | 3.60% |
| Percent within | A building with 2 to 10 apartments | 22.80% | 60.60% | 49.60% | 12.70% | 11.00% | 29.00% | 25.30% |
| Percent within | A building with more than 10 apartments | 13.10% | 6.70% | 16.30% | 11.00% | 3.70% | 0.60% | 0.00% |
| Percent within | Other | 1.80% | 0.00% | 1.80% | 0.70% | 0.00% | 1.90% | 1.50% |
| Percent by | A one-family house detached from any other house | 28.6% | 6.5% | 19.6% | 10.6% | 21.0% | 6.8% | 6.9% |
| Percent by | A one-family house attached to one or more houses | 41.3% | 14.1% | 22.9% | 2.9% | 9.0% | 7.6% | 2.2% |
| Percent by | A building with 2 to 10 apartments | 17.0% | 21.5% | 47.3% | 2.5% | 3.8% | 4.5% | 3.3% |
| Percent by | A building with more than 10 apartments | 31.3% | 7.6% | 49.8% | 6.8% | 4.1% | 0.3% | 0.0% |
| Percent by | Other | 36.8% | 0.0% | 46.2% | 3.8% | 0.0% | 8.0% | 5.2% |
Housing Characteristics
To download chart, right click on the chart and select “Save Image As”…