LFP HOUSING CHARACTERISTICS BY COMPLETE PLUMBING
CNMI Total
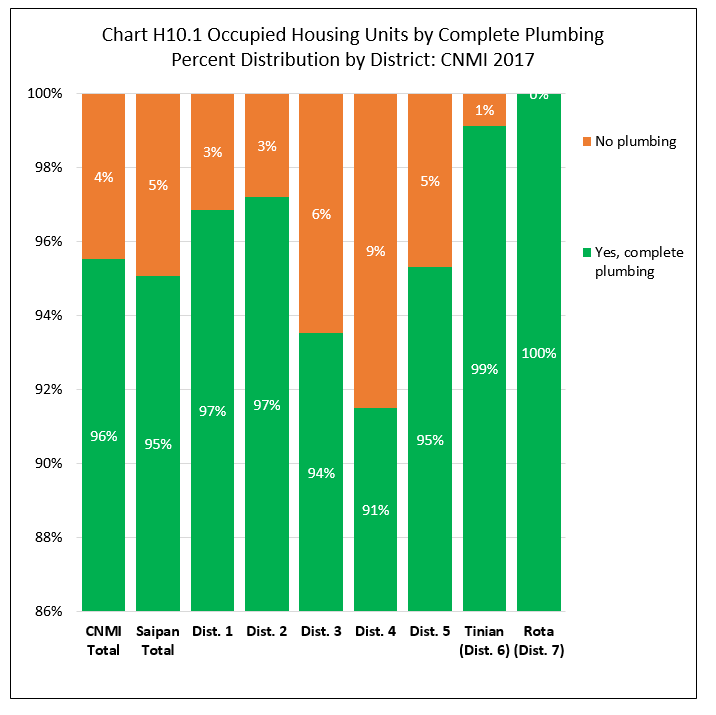
Units with complete plumbing was 95.5% of all occupied housing units in the CNMI in 2017 while units with no plumbing was only 4.5%.
By Island
In Saipan, units with complete plumbing was 95.1% of all occupied housing units while units with no plumbing was 4.9%. In Tinian, units with complete plumbing was 99.1% of all occupied housing units while units with no plumbing was only 0.9%. In Rota, all occupied housing units had complete plumbing.
By Saipan Districts
Within Saipan, percentage of units with complete plumbing was highest in Districts 2 (97.2%), and relatively lowest in District 4 (91.5%). The percentage of occupied units with no plumbing was highest in District 4 (8.5%) and lowest in Districts 1 (3.2%). See Chart H10.1 and Table H10.1 for detail.
Housing Characteristics
LFS 2017 Table H10.1
Labor Force Participation Measures
Table H10.1 Occupied Housing Units by Complete Plumbing, by Island, and by District: CNMI, 2017 4th Qtr.
| Saiapn District 1 |
Saiapn District 2 |
Saiapn District 3 |
Saiapn District 4 |
Saiapn District 5 |
Tinian District 6 |
Rota District 7 |
|||
|---|---|---|---|---|---|---|---|---|---|
| Source: Labor Force Survey CNMI, 2017 4th Qtr. | |||||||||
| Plumbing | Yes, complete plumbing | 4,195 | 1,993 | 5,165 | 1,026 | 1,924 | 891 | 764 | |
| Plumbing | No plumbing | 137 | 58 | 357 | 95 | 95 | 8 | – | |
| Percent within | Yes, complete plumbing | 96.8% | 97.2% | 93.5% | 91.5% | 95.3% | 99.1% | 100.0% | |
| Percent within | No plumbing | 3.2% | 2.8% | 6.5% | 8.5% | 4.7% | 0.9% | 0.0% | |
| Percent by | Yes, complete plumbing | 26.3% | 12.5% | 32.4% | 6.4% | 12.1% | 5.6% | 4.8% | |
| Percent by | No plumbing | 18.3% | 7.7% | 47.7% | 12.7% | 12.6% | 1.0% | 0.0% |
Housing Characteristics
To download chart, right click on the chart and select “Save Image As”…