LFP MEASURES BY EDUCATION LEVEL
TOTAL POPULATION BY EDUCATION LEVEL
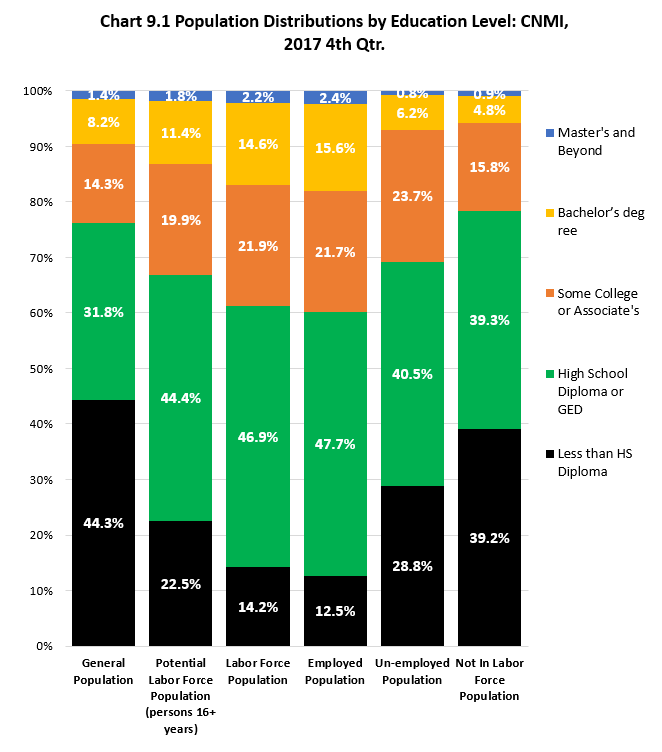
Less than high school diploma was 44% (23,176) of the total population in the CNMI at the time of the Survey, followed by high school diploma or GED at 32% (16,527), some college or associate degree (14%, 7,449), bachelor’s degree (8%, 4,272), and then master’s and beyond (1.4%, 739). Note that this distribution includes all ages.
POTENTIAL LABOR FORCE POPULATION BY EDUCATION LEVEL
The distribution of highest education level completed changes under the different labor force populations. High School Diploma or GED was 44% (16,621) of the potential labor force population at the time of the Survey. Less than HS Diploma was 23% (8,401), followed Some College or Associate’s (20%, 7,449), Bachelor’s (11%, 3,677), then Master’s and Beyond with 2%, (676).
LABOR FORCE POPULATION BY EDUCATION LEVEL
High School Diploma or GED made up 47% (11,785) of the labor force population at the time of the Survey. Some College or Associate’s followed with 22% (5,505), Bachelor’s was 15% (3,677), Less than HS Diploma was 14% (3,576), then Master’s and Beyond with 2%, (562).
EMPLOYED POPULATION BY EDUCATION LEVEL
High School Diploma or GED made up 48% (10,713) of the employed population at the time of the Survey. Some College or Associate’s followed with 22% (4,877), Bachelor’s was 16% (3,512), Less than HS Diploma was 13% (2,816), then Master’s and Beyond with 2%, (541).
UNEMPLOYED POPULATION BY EDUCATION LEVEL
High School Diploma or GED made up 41% (1,072) of the unemployed population at the time of the Survey. Less than HS Diploma was 29% (761), Some College or Associate’s followed with 24% (627), Bachelor’s was 6% (165), then Master’s and Beyond with less than 1%, (21).
NOT IN LABOR FORCE POPULATION BY EDUCATION LEVEL
Less than HS Diploma and High School Diploma or GED made up almost 80% (79%, 9,660) of the unemployed population at the time of the Survey. Some College or Associate’s followed with 16% (1,945), Bachelor’s was 5% (595), then Master’s and Beyond with less than 1%, (114).
UNEMPLOYMENT RATE BY EDUCATION LEVEL
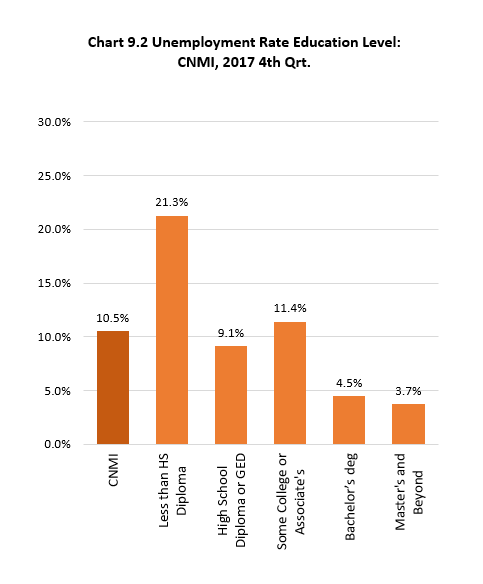
Unemployment rate was inversely related to education level as persons with higher level of education have a better chance of getting a job. Master’s and Beyond had the lowest unemployment at 3.7%, followed by Bachelor’s (4.5%), High School Diploma (9.1%), Some College or Associate’s (11.4%) and Less than HS Diploma had the highest unemployment rate at 21.3%.
LABOR FORCE PARTICIPATION RATE BY EDUCATION LEVEL
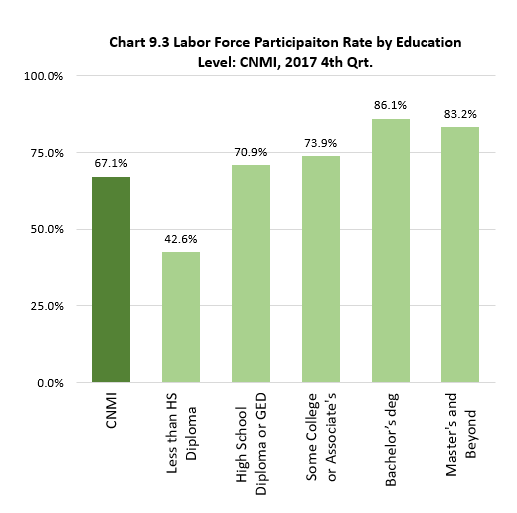
Labor force participation rate was positively related to education level as persons with higher education levels are more likely to seek and obtain jobs. Bachelor’s degree had the highest labor force participation rate of 86.1% at the time of the Survey. Master’s and Beyond was second highest at 83.2%, followed by Some College or Associate’s (73.9%), High School Diploma (70.9%), and Less than HS Diploma had the lowest labor force participation rate at 42.6%.
LFP 2017 Table9.0-1
Labor Force Participation Measures by Education Level: CNMI, 2017 4th Qtr.
| Education Level | General Population | Potential Labor Force Population (persons 16+ years) | Labor Force Population | Employed Population | Unemployed Population | Not In Labor Force Population | Unemployment Rate | Labor Force Participation Rate |
|---|---|---|---|---|---|---|---|---|
| Source: LFP 2017 CNMI CSD | ||||||||
| Less than HS Diploma | 23,176 | 8,401 | 3,576 | 2,816 | 761 | 4,825 | 21.3 % | 42.6 % |
| High School Diploma or GED | 16,627 | 16,621 | 11,785 | 10,713 | 1,072 | 4,835 | 9.1 % | 70.9 % |
| Some College or Associate’s | 7,449 | 7,449 | 5,505 | 4,877 | 627 | 1,945 | 11.4 % | 73.9 % |
| Bachelor’s degree | 4,272 | 4,272 | 3,677 | 3,512 | 165 | 595 | 4.5 % | 86.1 % |
| Master’s and Beyond | 739 | 676 | 562 | 541 | 21 | 114 | 3.7 % | 83.2 % |
LFP 2017 Table9.0-2
Labor Force Participation Measures by Education Level: CNMI, 2017 4th Qtr.
Table H09.2 Occupied Housing Units by Water Heater Energy, by Island, and by District: CNMI, 2017 4th Qtr.
| Utility | Saipan District 1 |
Saipan District 2 |
Saipan District 3 |
Saipan District 4 |
Saipan District 5 |
Tinian District 6 |
Rota District 7 |
|
|---|---|---|---|---|---|---|---|---|
| Source: Labor Force Survey CNMI, 2017 4th Qtr. | ||||||||
| Hot Water Energy | Electricity | 870 | 260 | 1,464 | 229 | 328 | 131 | 111 |
| Hot Water Energy | Gas or Solar | 99 | 79 | 161 | 52 | 57 | 6 | 6 |
| Hot Water Energy | Grand Total | 969 | 339 | 1,625 | 281 | 385 | 137 | 117 |
| Percent within | Electricity | 89.8% | 76.8% | 90.1% | 81.6% | 85.2% | 95.8% | 94.9% |
| Percent within | Gas or Solar | 10.2% | 23.2% | 9.9% | 18.4% | 14.8% | 4.2% | 5.1% |
| Percent by | Electricity | 25.6% | 7.7% | 43.1% | 6.8% | 9.7% | 3.9% | 3.3% |
| Percent by | Gas or Solar | 21.6% | 17.1% | 35.0% | 11.3% | 12.4% | 1.2% | 1.3% |
To download chart, right click on the chart and select “Save Image As”…