LFP HOUSING CHARACTERISTICS BY FREEZER
DescriptionTable DataCharts and Figures Data
CNMI Total
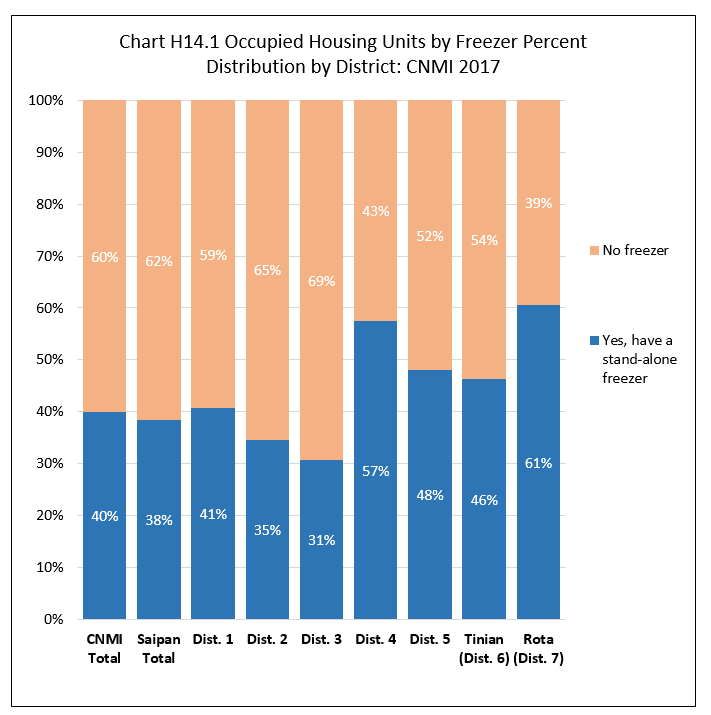
Units with a stand-alone freezer was 39.9% of all occupied housing units in the CNMI in 2017 while units with no freezer was 60.1%.
By Island
The percentage of occupied units with a stand-alone freezer was highest in Rota (60.6%), followed by Tinian (46.3%), then Saipan (38.4%).
By Saipan Districts
Within Saipan, the percentage of all units with a stand-alone freezer was highest in Districts 4 (57.5%) and was lowest in District 3 (30.7%). Please see Chart H14.1 and Table H14.1 for detail.
Housing Characteristics
LFS 2017 Table H14.1
Labor Force Participation Measures
Table H14.1 Occupied Housing Units by Stand-alone Freezer, by Island, and by District: CNMI, 2017 4th Qtr.
| Saipan District 1 |
Saipan District 2 |
Saipan District 3 |
Saipan District 4 |
Saipan District 5 |
Tinian District 6 |
Rota District 7 |
||
|---|---|---|---|---|---|---|---|---|
| Source: Labor Force Survey CNMI, 2017 4th Qtr. | ||||||||
| Freezer | Yes, have a stand-alone freezer | 1,763 | 710 | 1,694 | 645 | 969 | 416 | 463 |
| Freezer | No | 2,569 | 1,341 | 3,828 | 477 | 1,049 | 483 | 301 |
| Percent within | Yes, have a stand-alone freezer | 40.7% | 34.6% | 30.7% | 57.5% | 48.0% | 46.3% | 60.6% |
| Percent within | No | 59.3% | 65.4% | 69.3% | 42.5% | 52.0% | 53.7% | 39.4% |
| Percent by | Yes, have a stand-alone freezer | 26.5% | 10.7% | 25.4% | 9.7% | 14.6% | 6.2% | 7.0% |
| Percent by | No | 25.6% | 13.3% | 38.1% | 4.7% | 10.4% | 4.8% | 3.0% |
Housing Characteristics
To download chart, right click on the chart and select “Save Image As”…