LFP HOUSING CHARACTERISTICS BY MONTHLY COOKING GAS BILL
CNMI Total
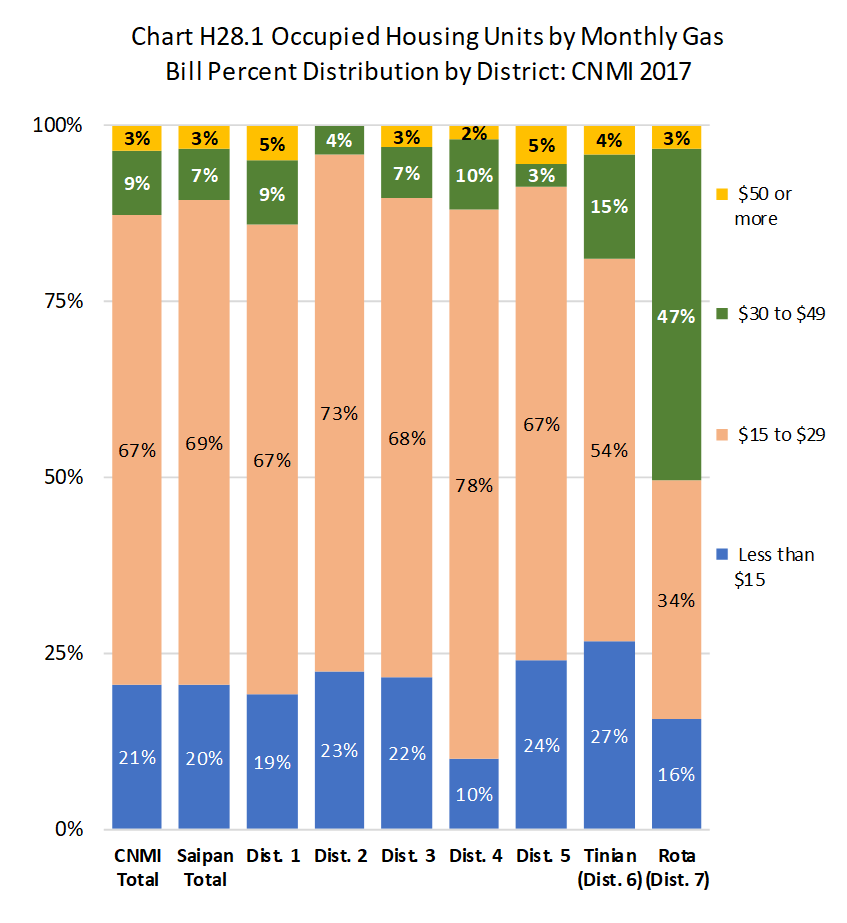
The monthly cooking gas bill median amount was $25.00 while the mean amount was $27.92 for all occupied units that used gas for cooking in the CNMI in 2017. Units with a monthly bill between $15 to $29 was 66.8% of all units cooking with gas; units that paid less than $15 was 20.6%; units that paid between $30 and $49 was 9.2%; while units that paid $50 or more was 3.4%.
By Island
The cooking gas monthly bill median and mean amounts were higher in Rota, $37.00 and $35,56, respectively, than in Tinian ($24.50 and $28.88, respectively) and Saipan ($24.00 and $26.45, respectively). In other words, units in Saipan spent less on cooking gas monthly, on average, than in Tinian and Rota. As shown in Chart H28.1 and Table H28.1, the percentage of all units that paid between$30 to $49 was 47.1% in Rota, 14.9% in Tinian, but only 7.0% in Saipan.
By Saipan Districts
Within Saipan, the cooking gas monthly bill median and mean amounts were higher in Districts 1 and 5 and lowest in District 2. The percentage of all units with cooking gas monthly bill between $15 and $29 was highest in District 4 (77.9%) and lowest in District 1 (66.7%). The percentage of all units with cooking gas monthly bill less than $15 was highest in District 5 (26.7%) and lowest in District 4 (10.0%). The percentage of all units with cooking gas monthly bill between $30 and $49 was highest in District 4 (10.0%) and lowest in District 3 (3.3%). The percentage of all units with cooking gas monthly bill $50 or more was highest in District 5 (5.3%) and lowest in District 4 (2.0%). See Chart H28.1 and Table H28.1 for detail.
Housing Characteristics
LFS 2017 Table H28.1
Labor Force Participation Measures
Table H28.1 Occupied Housing Units by Monthly Cooking Gas Bill, by Island, and by District: CNMI, 2017 4th Qtr.
| Saipan District 1 |
Saipan District 2 |
Saipan District 3 |
Saipan District 4 |
Saipan District 5 |
Tinian District 6 |
Rota District 7 |
||
|---|---|---|---|---|---|---|---|---|
| Source: Labor Force Survey CNMI, 2017 4th Qtr. | ||||||||
| Cooking Gas Monthly Bill | Less than $15.00 | 690 | 349 | 913 | 65 | 317 | 160 | 92 |
| Cooking Gas Monthly Bill | $15.00 to $29.99 | 1,394 | 1,248 | 3,085 | 642 | 712 | 323 | 131 |
| Cooking Gas Monthly Bill | $30.00 to $44.99 | 1,482 | 257 | 668 | 281 | 634 | 251 | 377 |
| Cooking Gas Monthly Bill | $45.00 to $59.99 | 178 | 38 | 240 | 21 | 19 | 48 | 39 |
| Cooking Gas Monthly Bill | $60.00 to $99.99 | 176 | 40 | 160 | 20 | 110 | 32 | 45 |
| Cooking Gas Monthly Bill | $100.00 + | 176 | – | 20 | – | 58 | 25 | 12 |
| Percent within | Less than $15.00 | 16.8% | 18.1% | 17.9% | 6.3% | 17.1% | 19.1% | 13.3% |
| Percent within | $15.00 to $29.99 | 34.0% | 64.6% | 60.7% | 62.4% | 38.5% | 38.4% | 18.8% |
| Percent within | $30.00 to $44.99 | 36.2% | 13.3% | 13.1% | 27.3% | 34.3% | 29.9% | 54.1% |
| Percent within | $45.00 to $59.99 | 4.3% | 2.0% | 4.7% | 2.0% | 1.0% | 5.8% | 5.7% |
| Percent within | $60.00 to $99.99 | 4.3% | 2.1% | 3.2% | 2.0% | 6.0% | 3.9% | 6.4% |
| Percent within | $100.00 + | 4.3% | 0.0% | 0.4% | 0.0% | 3.1% | 3.0% | 1.7% |
| Percent by | Less than $15.00 | 26.7% | 13.5% | 35.3% | 2.5% | 12.3% | 6.2% | 3.6% |
| Percent by | $15.00 to $29.99 | 18.5% | 16.6% | 40.9% | 8.5% | 9.5% | 4.3% | 1.7% |
| Percent by | $30.00 to $44.99 | 37.5% | 6.5% | 16.9% | 7.1% | 16.1% | 6.4% | 9.5% |
| Percent by | $45.00 to $59.99 | 30.5% | 6.6% | 41.1% | 3.6% | 3.2% | 8.3% | 6.8% |
| Percent by | $60.00 to $99.99 | 30.2% | 6.9% | 27.4% | 3.5% | 18.8% | 5.5% | 7.6% |
| Percent by | $100.00 + | 60.7% | 0.0% | 6.8% | 0.0% | 19.8% | 8.6% | 4.1% |
Housing Characteristics
To download chart, right click on the chart and select “Save Image As”…