LFP HOUSING CHARACTERISTICS BY NUMBER OF BEDROOMS
CNMI Total
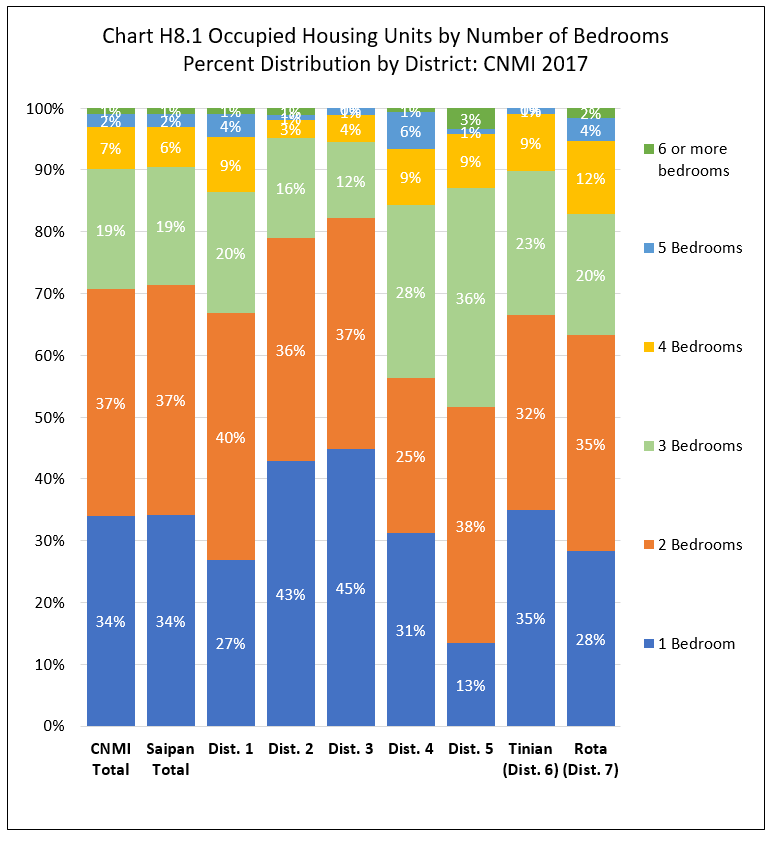
The median number of bedrooms was 2 and the mean was 2.1 in the CNMI in 2017. Two-bedroom units comprised 36.7% of all occupied housing units in the CNMI in 2017, followed by 1-bedroom units (34.0%), 3-bedroom units (19.5%), 4-bedroom units (6.8%), then 5-bedroom units (2.2%). Units with 6 or more bedrooms was 0.9% of all occupied housing units.
By Island
The median and mean number of bedroom were the same in all three islands. The number of bedrooms percent distributions for Rota and Tinian were similar in all three islands—Saipan, Tinian, and Rota.
By Saipan Districts
The median number of bedrooms was identical (2 bedrooms) in all districts while the mean ranged from 1.8 to 2.9 bedrooms.
Within Saipan, the 1-bedroom units percentage was higher in Districts 3 (44.9%), District 2 (43.0%), and District 4 (31.3%); 2-bedroom units percentage was higher in District 1 (40.0%), District 2 (36.0%), District 3 (37.3%), and District 5 (38.2%); while 3-bedroom units percentage was higher in District 5 (35.6%), and District 4 (28.1%). See Chart H8.1 and Table H8.1 for detail.
Housing Characteristics
LFS 2017 Table H8.1
Labor Force Participation Measures
Table H8.1 Occupied Housing Units by Number of Bedrooms, by Island, and by District: CNMI, 2017 4th Qtr.
| Saipan District 1 |
Saipan District 2 |
Saipan District 3 |
Saipan District 4 |
Saipan District 5 |
Tinian District 6 |
Rota District 7 |
||
|---|---|---|---|---|---|---|---|---|
| Source: Labor Force Survey CNMI, 2017 4th Qtr. | ||||||||
| Rooms | 1 Bedroom | 1,166 | 881 | 2,478 | 351 | 271 | 315 | 216 |
| Rooms | 2 Bedrooms | 1,733 | 738 | 2,061 | 280 | 771 | 283 | 268 |
| Rooms | 3 Bedrooms | 846 | 333 | 679 | 315 | 718 | 209 | 150 |
| Rooms | 4 Bedrooms | 387 | 58 | 245 | 101 | 174 | 84 | 90 |
| Rooms | 5 Bedrooms | 162 | 19 | 59 | 67 | 19 | 8 | 28 |
| Rooms | 6 or more bedrooms | 38 | 21 | – | 8 | 66 | – | 12 |
| Percent within | 1 Bedroom | 26.9% | 43.0% | 44.9% | 31.3% | 13.4% | 35.0% | 28.3% |
| Percent within | 2 Bedrooms | 40.0% | 36.0% | 37.3% | 25.0% | 38.2% | 31.5% | 35.0% |
| Percent within | 3 Bedrooms | 19.5% | 16.3% | 12.3% | 28.1% | 35.6% | 23.3% | 19.6% |
| Percent within | 4 Bedrooms | 8.9% | 2.8% | 4.4% | 9.0% | 8.6% | 9.3% | 11.8% |
| Percent within | 5 Bedrooms | 3.7% | 0.9% | 1.1% | 6.0% | 0.9% | 0.9% | 3.7% |
| Percent within | 6 or more bedrooms | 0.9% | 1.0% | 0.0% | 0.7% | 3.3% | 0.0% | 1.6% |
| Percent by | 1 Bedroom | 20.5% | 15.5% | 43.6% | 6.2% | 4.8% | 5.5% | 3.8% |
| Percent by | 2 Bedrooms | 28.3% | 12.0% | 33.6% | 4.6% | 12.6% | 4.6% | 4.4% |
| Percent by | 3 Bedrooms | 26.0% | 10.3% | 20.9% | 9.7% | 22.1% | 6.4% | 4.6% |
| Percent by | 4 Bedrooms | 34.0% | 5.1% | 21.5% | 8.9% | 15.3% | 7.4% | 7.9% |
| Percent by | 5 Bedrooms | 44.8% | 5.3% | 16.3% | 18.5% | 5.1% | 2.1% | 7.8% |
| Percent by | 6 or more bedrooms | 26.3% | 14.4% | 0.0% | 5.2% | 45.8% | 0.0% | 8.3% |
Housing Characteristics
To download chart, right click on the chart and select “Save Image As”…