LFP HOUSING CHARACTERISTICS BY NUMBER OF ROOMS
CNMI Total
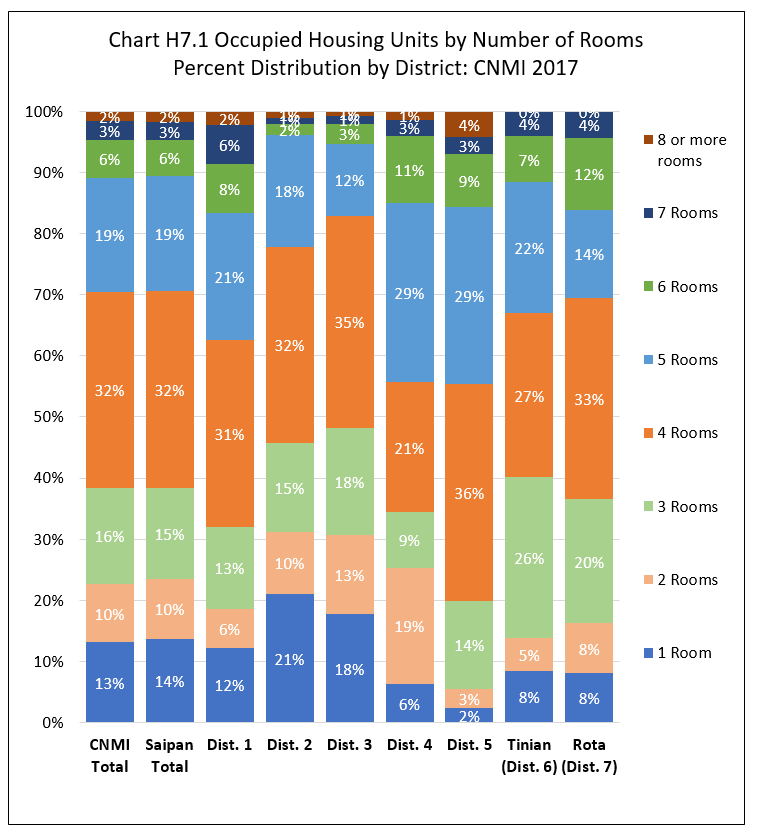
The median number of rooms was 4 and the mean was 3.8 per occupied housing unit in the CNMI in 2017. Housing units with 4 rooms comprised 32.1% of all occupied housing units, followed by units with 5 rooms (18.8%), units with 3 rooms (15.7%), units with 1 room (13.1%), units with 2 rooms (9.5%), units with 6 rooms (6.2%), then units with 7 rooms (3.1%). Units with 8 or more rooms was 1.5% of all occupied housing units.
By Island
There was no difference in the median and mean number of rooms in Saipan, Tinian, and Rota. However, percentages of units with 1 room and units with 8 or more rooms were relatively higher in Saipan (13.1%) compared to Titian (8.5%) and Rota (8.1%).
By Saipan Districts
Within Saipan, the median number of rooms was identical in all districts while the mean ranged from 3.9 to 4.5 rooms. The number of rooms percent distributions was similar across all 5 districts with a few notable differences: Districts 2 and 3 had relatively higher percentages in the 1 room category; Districts 4 and 5 had relatively higher percentages in the 5 rooms category. See Chart 7.1 and Table H7.1 for detail.
Housing Characteristics
LFS 2017 Table H7.1
Labor Force Participation Measures
Table H7.1 Occupied Housing Units by Number of Rooms, by Island, and by District: CNMI, 2017 4th Qtr.
| Saipan District 1 |
Saipan District 2 |
Saipan District 3 |
Saipan District 4 |
Saipan District 5 |
Tinian District 6 |
Rota District 7 |
||
|---|---|---|---|---|---|---|---|---|
| Source: Labor Force Survey CNMI, 2017 4th Qtr. | ||||||||
| Rooms | 1 Room | 529 | 429 | 979 | 70 | 47 | 76 | 62 |
| Rooms | 2 Rooms | 277 | 211 | 715 | 213 | 63 | 48 | 62 |
| Rooms | 3 Rooms | 578 | 298 | 968 | 102 | 290 | 237 | 156 |
| Rooms | 4 Rooms | 1,332 | 658 | 1,920 | 238 | 717 | 242 | 251 |
| Rooms | 5 Rooms | 897 | 375 | 645 | 329 | 586 | 193 | 111 |
| Rooms | 6 Rooms | 348 | 38 | 186 | 124 | 176 | 67 | 90 |
| Rooms | 7 Rooms | 274 | 19 | 70 | 28 | 54 | 36 | 33 |
| Rooms | 8 or more rooms | 97 | 21 | 39 | 16 | 85 | – | – |
| Percent within | 1 Room | 12.2% | 20.9% | 17.7% | 6.2% | 2.3% | 8.5% | 8.1% |
| Percent within | 2 Rooms | 6.4% | 10.3% | 12.9% | 19.0% | 3.1% | 5.3% | 8.1% |
| Percent within | 3 Rooms | 13.3% | 14.6% | 17.5% | 9.1% | 14.4% | 26.3% | 20.4% |
| Percent within | 4 Rooms | 30.7% | 32.1% | 34.8% | 21.3% | 35.5% | 26.9% | 32.9% |
| Percent within | 5 Rooms | 20.7% | 18.3% | 11.7% | 29.4% | 29.0% | 21.5% | 14.5% |
| Percent within | 6 Rooms | 8.0% | 1.9% | 3.4% | 11.1% | 8.7% | 7.4% | 11.8% |
| Percent within | 7 Rooms | 6.3% | 0.9% | 1.3% | 2.5% | 2.7% | 4.1% | 4.3% |
| Percent within | 8 or more rooms | 2.2% | 1.0% | 0.7% | 1.4% | 4.2% | 0.0% | 0.0% |
| Percent by | 1 Room | 24.1% | 19.6% | 44.7% | 3.2% | 2.1% | 3.5% | 2.8% |
| Percent by | 2 Rooms | 17.4% | 13.3% | 45.0% | 13.4% | 4.0% | 3.0% | 3.9% |
| Percent by | 3 Rooms | 22.0% | 11.3% | 36.8% | 3.9% | 11.0% | 9.0% | 5.9% |
| Percent by | 4 Rooms | 24.9% | 12.3% | 35.8% | 4.4% | 13.4% | 4.5% | 4.7% |
| Percent by | 5 Rooms | 28.6% | 12.0% | 20.6% | 10.5% | 18.7% | 6.2% | 3.5% |
| Percent by | 6 Rooms | 33.8% | 3.7% | 18.1% | 12.0% | 17.1% | 6.5% | 8.8% |
| Percent by | 7 Rooms | 53.2% | 3.7% | 13.6% | 5.5% | 10.5% | 7.1% | 6.3% |
| Percent by | 8 or more rooms | 37.7% | 8.1% | 15.1% | 6.0% | 33.0% | 0.0% | 0.0% |
Housing Characteristics
To download chart, right click on the chart and select “Save Image As”…