LFP HOUSING CHARACTERISTICS BY OCCUPANCY TYPE
CNMI Total
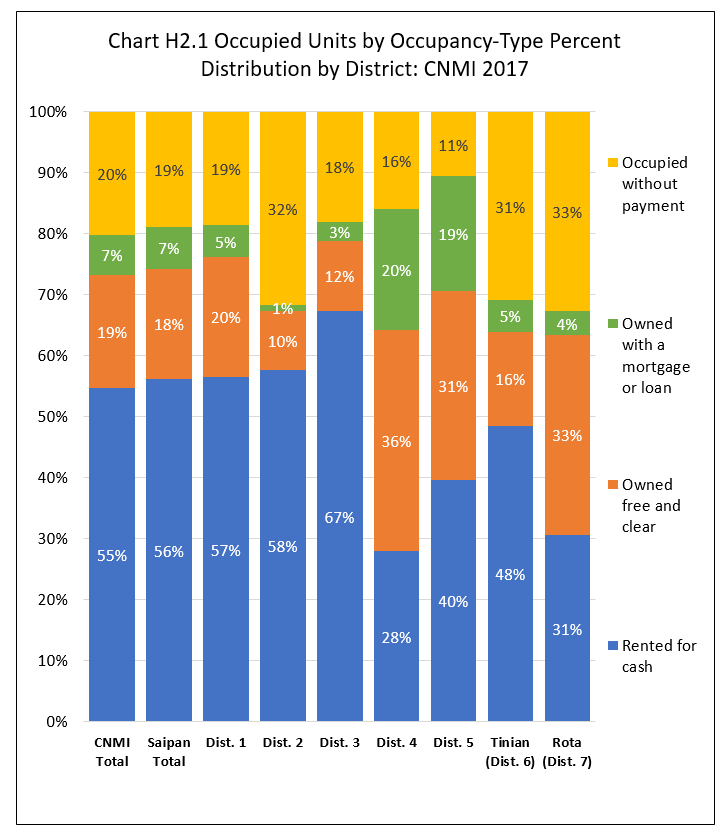
Units rented for cash was 54.7% of all occupied housing units in the CNMI in 2017; units occupied without cash payment was 20.1%; units owned free and clear was 18.6%; while units owned with a mortgage or loan was about 6.6%.
By Island
The percentage of all occupied housing units rented for cash was highest in Saipan (56.3%), followed by Tinian (48.5%) and lowest in Rota (30.7%). The percentage of all occupied units occupied without cash payment was highest in Rota (32.7%), followed by Tinian (30.9%), and was lowest in Saipan (20.1%). The percentage owned free and clear was highest in Rota (32.7%), followed by Saipan (18.6%), and lowest in Tinian (15.5%). The percentage owned with a mortgage or loan was highest in Saipan (6.6%), followed by Tinian (5.1%), and lowest in Rota (3.9%).
By Saipan Districts
Within Saipan, units rented for cash percentage was highest in District 3 (67.4%) followed by District 2 (57.7%) and District 1 (56.6%), while relatively lower in District 5 (39.6%) and District 4 (28.0%). Owner occupied units’ percentage was higher in Districts 4 (56.1%) and 5 (49.9%) and lower in Districts 1 (24.9%), 3 (14.6%), and 2 (10.6%). See Chart H2.1 and Table H2.1 for detail.
Housing Characteristics
LFS 2017 Table H2.1
Labor Force Participation Measures
Table H2.1 Occupied Housing Units by Occupancy Type, by Island, and by District: CNMI, 2017 4th Qtr.
| Saipan District 1 |
Saipan District 2 |
Saipan District 3 |
Saipan District 4 |
Saipan District 5 |
Tinian District 6 |
Rota District 7 |
||
|---|---|---|---|---|---|---|---|---|
| Source: Labor Force Survey CNMI, 2017 4th Qtr. | ||||||||
| Housing Unit | Owned with a mortgage or loan | 231 | 19 | 171 | 223 | 381 | 46 | 30 |
| Housing Unit | Owned free and clear | 848 | 199 | 636 | 406 | 625 | 139 | 250 |
| Housing Unit | Rented for cash | 2,451 | 1,183 | 3,719 | 314 | 799 | 436 | 234 |
| Housing Unit | Occupied without payment | 802 | 649 | 996 | 178 | 213 | 278 | 250 |
| Percent within | Owned with a mortgage or loan | 5.3% | 0.9% | 3.1% | 19.9% | 18.9% | 5.1% | 3.9% |
| Percent within | Owned free and clear | 19.6% | 9.7% | 11.5% | 36.2% | 31.0% | 15.5% | 32.7% |
| Percent within | Rented for cash | 56.6% | 57.7% | 67.4% | 28.0% | 39.6% | 48.5% | 30.7% |
| Percent within | Occupied without payment | 18.5% | 31.7% | 18.0% | 15.9% | 10.6% | 30.9% | 32.7% |
| Percent by | Owned with a mortgage or loan | 21.0% | 1.7% | 15.5% | 20.3% | 34.6% | 4.2% | 2.7% |
| Percent by | Owned free and clear | 27.3% | 6.4% | 20.5% | 13.1% | 20.1% | 4.5% | 8.1% |
| Percent by | Rented for cash | 26.8% | 13.0% | 40.7% | 3.4% | 8.7% | 4.8% | 2.6% |
| Percent by | Occupied without payment | 23.8% | 19.3% | 29.6% | 5.3% | 6.3% | 8.2% | 7.4% |
Housing Characteristics
To download chart, right click on the chart and select “Save Image As”…