LFP HOUSING CHARACTERISTICS BY ROOF MATERIAL TYPE
CNMI Total
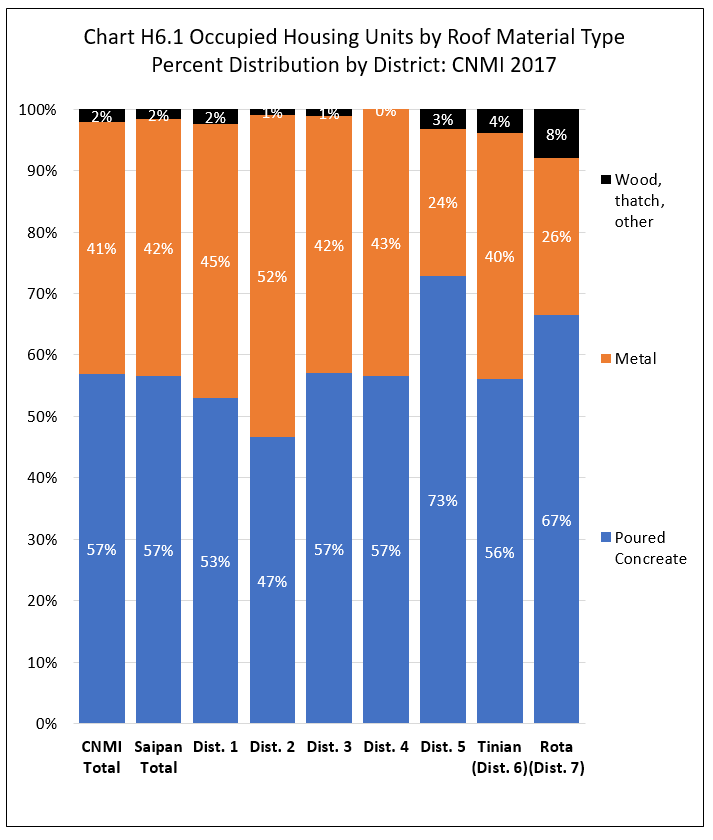
Units with concrete roof was 56.5% of all occupied housing units in the CNMI in 2017; units with metal roof was 41.8%; while units with wood, thatch, and/or other material roof was 2.0%.
By Island
The percentage of occupied units with concrete roof was highest in Rota (66.7%), followed by Saipan (56.5%), then Tinian (56.2%). The percentage of units with metal roof was highest in Saipan (41.8%), followed by Tinian (40.0%), then Rota (25.5%). The percentage of units with wood, thatch, or other material roof was highest in Rota (7.9%), followed by Tinian (3.9%), then Saipan (1.6%).
By Saipan Districts
Within Saipan, units with concrete roof percentage was highest in District 5 (72.9%) followed by District 4 and District 3 (both 57.0%), District 1 (53.0%) and then District 2 (46.6%). Units with metal roof percentage was highest in District 2 (52.4%), followed by District 1 (44.6%), District 4 (43.4%), District 3 (41.9%), then District 5 (23.9%). See Chart H6.1 and Table H6.1 for detail.
Housing Characteristics
LFS 2017 Table H6.1
Labor Force Participation Measures
Table H6.1 Occupied Housing Units by Roof Material Type, by Island, and by District: CNMI, 2017 4th Qtr.
| Saipan District 1 |
Saipan District 2 |
Saipan District 3 |
Saipan District 4 |
Saipan District 5 |
Tinian District 6 |
Rota District 7 |
||
|---|---|---|---|---|---|---|---|---|
| Source: Labor Force Survey CNMI, 2017 4th Qtr. | ||||||||
| Roof Material | Poured Concreate | 2,297 | 956 | 3,147 | 634 | 1,472 | 505 | 509 |
| Roof Material | Metal | 1,933 | 1,075 | 2,316 | 487 | 483 | 359 | 195 |
| Roof Material | Wood, thatch, other | 103 | 19 | 59 | – | 63 | 35 | 60 |
| Percent within | Poured Concreate | 53.0% | 46.6% | 57.0% | 56.6% | 72.9% | 56.2% | 66.6% |
| Percent within | Metal | 44.6% | 52.4% | 41.9% | 43.4% | 23.9% | 40.0% | 25.5% |
| Percent within | Wood, thatch, other | 2.4% | 0.9% | 1.1% | 0.0% | 3.1% | 3.9% | 7.9% |
| Percent by | Poured Concreate | 24.1% | 10.0% | 33.1% | 6.7% | 15.5% | 5.3% | 5.3% |
| Percent by | Metal | 28.2% | 15.7% | 33.8% | 7.1% | 7.1% | 5.2% | 2.9% |
| Percent by | Wood, thatch, other | 30.3% | 5.7% | 17.3% | 0.0% | 18.7% | 10.2% | 17.8% |
Housing Characteristics
To download chart, right click on the chart and select “Save Image As”…