Labor Force Participation Measures
INTRODUCTION/ORGANIZATION
This report presents the estimated total population, potential labor force population, labor force population, employed population, unemployed population, and not in labor force population in the CNMI during the Fourth Quarter of 2017. It also presents the unemployment rate and the labor force participation rate in the Commonwealth at that time. Hereon these measures are collectively referred to as the labor force participation measures (LFP Measures).
Before presenting the relevant estimates, the LFP Measures are defined first. Then the broadest (CNMI-wide) estimates for each of the LFP Measures are presented with the aid of a waterfall chart. Following the broad estimates, the LFP measures are presented by Island and District, followed by LFP measures by Gender, by Age Group, by Ethnic Group, by Citizenship, by Birthplace, by Migrate Reason, by Marital Status, by Education Level, by Education Place, and by Language spoken at home. Appendix A describes the survey methodology and how the population and survey weights were estimated and Appendix B is the survey questionnaire.
GENERAL POPULATION
The general (total) population in the Commonwealth include all persons who lived or resided in the CNMI including persons in the Island of Saipan, Tinian, and Rota. It includes permanent and temporary residents but excludes tourists.
POTENTIAL LABOR FORCE POPULATION
The potential labor force population consists of all persons 16 years old and older within the total population. The potential labor force population is divided into two sub-populations: 1) the labor force population and 2) the not in labor force population.
LABOR FORCE POPULATION
The labor force population includes all persons currently available to participate in or supply the productive activities in the economy. The labor force population, itself, is divided into two sub-populations: 1) the employed population and 2) the unemployed population.
EMPLOYED POPULATION
The employed population include all persons who currently have jobs, during the survey period. It includes persons with full-time as well as those with part-time jobs. Employed persons currently supply labor in the market place at the time of the survey.
UNEMPLOYED POPULATION
The unemployed population includes all persons who did not have a job, were actively looking for a job, and could have taken a job, at the time of the Survey. As already pointed out above, it is the complement of the employed population, i.e., these two combined make up the labor force population. While not engaged in the production activities at the time of the survey, unemployed persons are readily available to supply labor at the time of the survey.
NOT-IN-LABOR FORCE POPULATION
The not in labor force population include all persons, sixteen years old and older, currently with no jobs, and are not actively looking for a job. As stated earlier, it is the complement of the labor force population, i.e. these two combined constitute the potential labor force population.
UNEMPLOYMENT RATE
One of the most common measure of labor force utilization in the economy is the unemployment rate. This measure is derived by dividing the unemployed population by labor force population.
LABOR FORCE PARTICIPATION RATE
Another useful measure of labor utilization in the economy is the labor force participation rate. This measure is derived by dividing the in-labor force population by the potential labor force population. In other words, it is the proportion of the potential labor force population that is currently available to supply labor productivity in the economy.
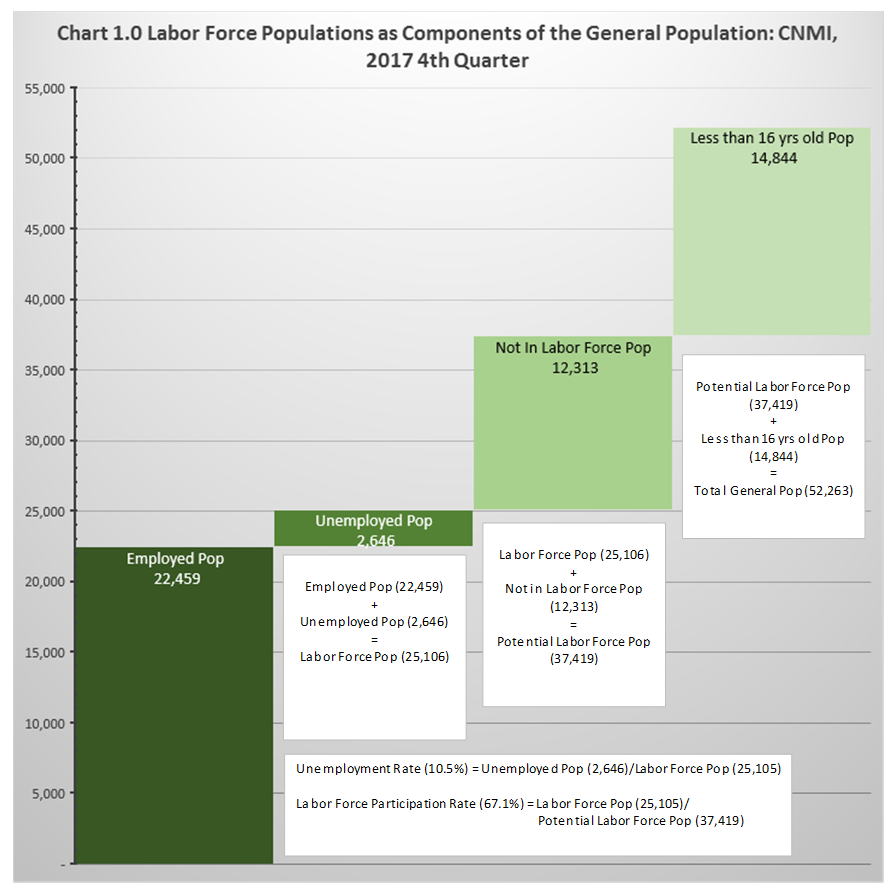
The estimated total population in the Commonwealth in 2017 was 52,263 . Chart 1.0, below, disaggregates this total into its various components (or sub-populations) and illustrates the relationships among them. The estimated employed population was 22,459 workers while the unemployed population was 2,646 persons. These two complementary populations combine to form the estimated labor force population of 25,106 persons. The not in labor force population was 12,313 persons, which when added to its complementary, the labor force population, constitute the potential labor force population of 37,419 persons. The potential labor force population (consisting of all 16 years old and older) plus the less than 16 years old population equals the estimated total population of 52,263 persons. Please see Appendix A for details on how the general population and the various labor force populations were derived. It is important to note that the employed population was almost 90% of the labor force population; that the labor force population was 67% of the potential labor force population; and that the potential labor force population was 72% of the general population. Because the employed population is a major component of the other labor force populations, namely, the labor force and the potential labor force populations, its characteristics/patterns underlie these other labor force populations.
To download chart, right click on the chart and select “Save Image As”…