CNMI LABOR FORCE PARTICIPATION SURVEY 2017 POPULATION CHARACTERISTICS
CNMI Total
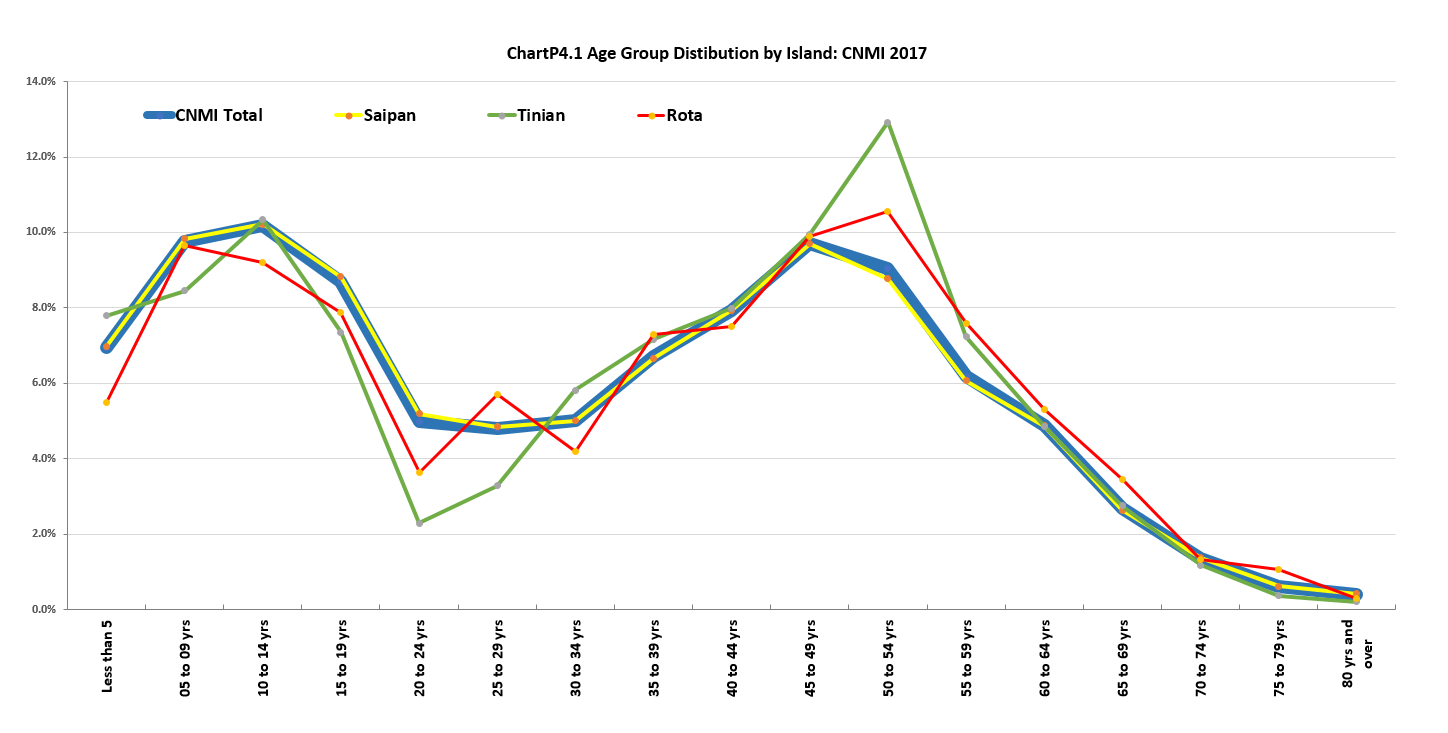
The median age was 34.0 years and the mean was 32.9 in the CNMI in 2017. The 10 to 14 years was the largest five-year age group, followed closely by 05 to 09 years (9.8%), 45 to 49 years (9.7%), 50 to 54 years (9.1%), 15 to 19 years (8.7%), 40 to 44 years (7.9%).
By Island
The median and mean ages were higher in Rota (38.0, 34.8, respectively) than in Tinian (37.0, 33.9) and in Saipan (33.0, 32.9). Note that age group percent distribution for Saipan (yellow line) and the CNMI Total (blue line) were highly correlated. This was so mainly because 91.0% of the CNMI’s Total population was in Saipan. Rota’s age group percent distribution (the red line) deviated slightly from the CNMI’s. Tinian’s age distribution deviated a little more from the CNMI’s, especially in age groups 20 to 29 years and in age group 50 to 54 years.
By Saipan Districts
The median and mean ages were practically the same in all districts except in District 4 where the median, the mean, and the percentages of age groups 40 to 44 years and 45 to 49 years were noticeably higher than in the other districts.
Population Characteristics
LFS 2017 Table P4.1 Age Group by Island and by District: CNMI 2017 Fourth Qtr.
| Age Group | CNMI Total |
Saipan Total |
Saipan Dist. 1 |
Saipan Dist. 2 |
Saipan Dist. 3 |
Saipan Dist. 4 |
Saipan Dist. 5 |
Tinian Dist. 6 |
Rota Dist. 7 |
|---|---|---|---|---|---|---|---|---|---|
| Source: Labor Force Survey CNMI, 2017 4th Qrt. | |||||||||
| Less than 5 | 3,632 | 3,314 | 863 | 585 | 1,035 | 280 | 551 | 205 | 114 |
| 05 to 09 yrs | 5,102 | 4,680 | 1,404 | 857 | 1,605 | 405 | 409 | 222 | 200 |
| 10 to 14 yrs | 5,322 | 4,859 | 1,768 | 580 | 1,428 | 402 | 681 | 272 | 191 |
| 15 to 19 yrs | 4,553 | 4,197 | 1,169 | 527 | 1,262 | 348 | 890 | 193 | 163 |
| 20 to 24 yrs | 2,608 | 2,472 | 838 | 332 | 522 | 248 | 532 | 60 | 75 |
| 25 to 29 yrs | 2,513 | 2,308 | 643 | 195 | 601 | 319 | 549 | 86 | 118 |
| 30 to 34 yrs | 2,624 | 2,384 | 802 | 396 | 583 | 202 | 401 | 153 | 87 |
| 35 to 39 yrs | 3,512 | 3,172 | 1,002 | 546 | 967 | 188 | 469 | 188 | 151 |
| 40 to 44 yrs | 4,144 | 3,779 | 1,129 | 450 | 1,532 | 229 | 438 | 210 | 155 |
| 45 to 49 yrs | 5,079 | 4,613 | 1,270 | 522 | 1,859 | 198 | 763 | 262 | 205 |
| 50 to 54 yrs | 4,730 | 4,173 | 1,158 | 639 | 1,400 | 326 | 649 | 339 | 218 |
| 55 to 59 yrs | 3,234 | 2,886 | 980 | 215 | 1,008 | 205 | 479 | 190 | 157 |
| 60 to 64 yrs | 2,556 | 2,318 | 779 | 389 | 614 | 218 | 318 | 128 | 110 |
| 65 to 69 yrs | 1,396 | 1,252 | 218 | 236 | 455 | 131 | 212 | 72 | 71 |
| 70 to 74 yrs | 716 | 657 | 214 | 59 | 203 | 124 | 56 | 31 | 27 |
| 75 to 79 yrs | 328 | 296 | 78 | 19 | 122 | 39 | 38 | 10 | 22 |
| 80 yrs and over | 215 | 203 | 99 | 19 | 19 | 28 | 37 | 6 | 6 |
LFS 2017 Table P4.1 Median and Mean Age Group by Island and by District: CNMI 2017 Fourth Qtr.
| Age Group | CNMI Total |
Saipan Total |
Saipan Dist. 1 |
Saipan Dist. 2 |
Saipan Dist. 3 |
Saipan Dist. 4 |
Saipan Dist. 5 |
Tinian Dist. 6 |
Rota Dist. 7 |
|---|---|---|---|---|---|---|---|---|---|
| Source: Labor Force Survey CNMI, 2017 4th Qrt. | |||||||||
| Median Age | 34.0 | 33.0 | 32.5 | 32.0 | 37.0 | 29.0 | 32.0 | 37.0 | 38.0 |
| Mean Age | 32.9 | 32.5 | 32.3 | 31.1 | 33.3 | 32.1 | 32.6 | 33.9 | 34.8 |
LFS 2017 Table P4.1 Age Group by Island and by District: CNMI 2017 Fourth Qtr. (Distribution Within)
| Age Group | CNMI Total |
Saipan Total |
Saipan Dist. 1 |
Saipan Dist. 2 |
Saipan Dist. 3 |
Saipan Dist. 4 |
Saipan Dist. 5 |
Tinian Dist. 6 |
Rota Dist. 7 |
|---|---|---|---|---|---|---|---|---|---|
| Source: Labor Force Survey CNMI, 2017 4th Qrt. | |||||||||
| Less than 5 | 6.9% | 7.0% | 6.0% | 8.9% | 6.8% | 7.2% | 7.4% | 7.8% | 5.5% |
| 05 to 09 yrs | 9.8% | 9.8% | 9.7% | 13.1% | 10.5% | 10.4% | 5.5% | 8.5% | 9.7% |
| 10 to 14 yrs | 10.2% | 10.2% | 12.3% | 8.8% | 9.4% | 10.3% | 9.1% | 10.3% | 9.2% |
| 15 to 19 yrs | 8.7% | 8.8% | 8.1% | 8.0% | 8.3% | 8.9% | 11.9% | 7.4% | 7.9% |
| 20 to 24 yrs | 5.0% | 5.2% | 5.8% | 5.1% | 3.4% | 6.4% | 7.1% | 2.3% | 3.6% |
| 25 to 29 yrs | 4.8% | 4.9% | 4.5% | 3.0% | 4.0% | 8.2% | 7.3% | 3.3% | 5.7% |
| 30 to 34 yrs | 5.0% | 5.0% | 5.6% | 6.0% | 3.8% | 5.2% | 5.4% | 5.8% | 4.2% |
| 35 to 39 yrs | 6.7% | 6.7% | 7.0% | 8.3% | 6.4% | 4.8% | 6.3% | 7.2% | 7.3% |
| 40 to 44 yrs | 7.9% | 7.9% | 7.8% | 6.9% | 10.1% | 5.9% | 5.9% | 8.0% | 7.5% |
| 45 to 49 yrs | 9.7% | 9.7% | 8.8% | 7.9% | 12.2% | 5.1% | 10.2% | 10.0% | 9.9% |
| 50 to 54 yrs | 9.1% | 8.8% | 8.0% | 9.7% | 9.2% | 8.4% | 8.7% | 12.9% | 10.5% |
| 55 to 59 yrs | 6.2% | 6.1% | 6.8% | 3.3% | 6.6% | 5.3% | 6.4% | 7.2% | 7.6% |
| 60 to 64 yrs | 4.9% | 4.9% | 5.4% | 5.9% | 4.0% | 5.6% | 4.3% | 4.9% | 5.3% |
| 65 to 69 yrs | 2.7% | 2.6% | 1.5% | 3.6% | 3.0% | 3.4% | 2.8% | 2.8% | 3.4% |
| 70 to 74 yrs | 1.4% | 1.4% | 1.5% | 0.9% | 1.3% | 3.2% | 0.7% | 1.2% | 1.3% |
| 75 to 79 yrs | 0.6% | 0.6% | 0.5% | 0.3% | 0.8% | 1.0% | 0.5% | 0.4% | 1.1% |
| 80 yrs and over | 0.4% | 0.4% | 0.7% | 0.3% | 0.1% | 0.7% | 0.5% | 0.2% | 0.3% |
LFS 2017 Table P4.1 Age Group by Island and by District: CNMI 2017 Fourth Qtr. (Distribution Amoung)
| Age Group | CNMI Total |
Saipan Total |
Saipan Dist. 1 |
Saipan Dist. 2 |
Saipan Dist. 3 |
Saipan Dist. 4 |
Saipan Dist. 5 |
Tinian Dist. 6 |
Rota Dist. 7 |
|---|---|---|---|---|---|---|---|---|---|
| Source: Labor Force Survey CNMI, 2017 4th Qrt. | |||||||||
| Less than 5 | 100% | 91.2% | 23.8% | 16.1% | 28.5% | 7.7% | 15.2% | 5.6% | 3.1% |
| 05 to 09 yrs | 100% | 91.7% | 27.5% | 16.8% | 31.4% | 7.9% | 8.0% | 4.4% | 3.9% |
| 10 to 14 yrs | 100% | 91.3% | 33.2% | 10.9% | 26.8% | 7.6% | 12.8% | 5.1% | 3.6% |
| 15 to 19 yrs | 100% | 92.2% | 25.7% | 11.6% | 27.7% | 7.6% | 19.6% | 4.2% | 3.6% |
| 20 to 24 yrs | 100% | 94.8% | 32.1% | 12.7% | 20.0% | 9.5% | 20.4% | 2.3% | 2.9% |
| 25 to 29 yrs | 100% | 91.9% | 25.6% | 7.8% | 23.9% | 12.7% | 21.9% | 3.4% | 4.7% |
| 30 to 34 yrs | 100% | 90.9% | 30.6% | 15.1% | 22.2% | 7.7% | 15.3% | 5.8% | 3.3% |
| 35 to 39 yrs | 100% | 90.3% | 28.5% | 15.6% | 27.5% | 5.3% | 13.3% | 5.4% | 4.3% |
| 40 to 44 yrs | 100% | 91.2% | 27.2% | 10.9% | 37.0% | 5.5% | 10.6% | 5.1% | 3.7% |
| 45 to 49 yrs | 100% | 90.8% | 25.0% | 10.3% | 36.6% | 3.9% | 15.0% | 5.1% | 4.0% |
| 50 to 54 yrs | 100% | 88.2% | 24.5% | 13.5% | 29.6% | 6.9% | 13.7% | 7.2% | 4.6% |
| 55 to 59 yrs | 100% | 89.3% | 30.3% | 6.6% | 31.2% | 6.3% | 14.8% | 5.9% | 4.9% |
| 60 to 64 yrs | 100% | 90.7% | 30.5% | 15.2% | 24.0% | 8.5% | 12.4% | 5.0% | 4.3% |
| 65 to 69 yrs | 100% | 89.7% | 15.6% | 16.9% | 32.6% | 9.4% | 15.2% | 5.2% | 5.1% |
| 70 to 74 yrs | 100% | 91.9% | 30.0% | 8.3% | 28.4% | 17.4% | 7.8% | 4.3% | 3.8% |
| 75 to 79 yrs | 100% | 90.3% | 23.9% | 5.9% | 37.1% | 11.8% | 11.6% | 2.9% | 6.8% |
| 80 yrs and over | 100% | 94.6% | 46.0% | 8.9% | 9.0% | 13.2% | 17.4% | 2.6% | 2.8% |
Population Characteristics
To download, right click on the chart and select “Save Image As”…