CNMI Total
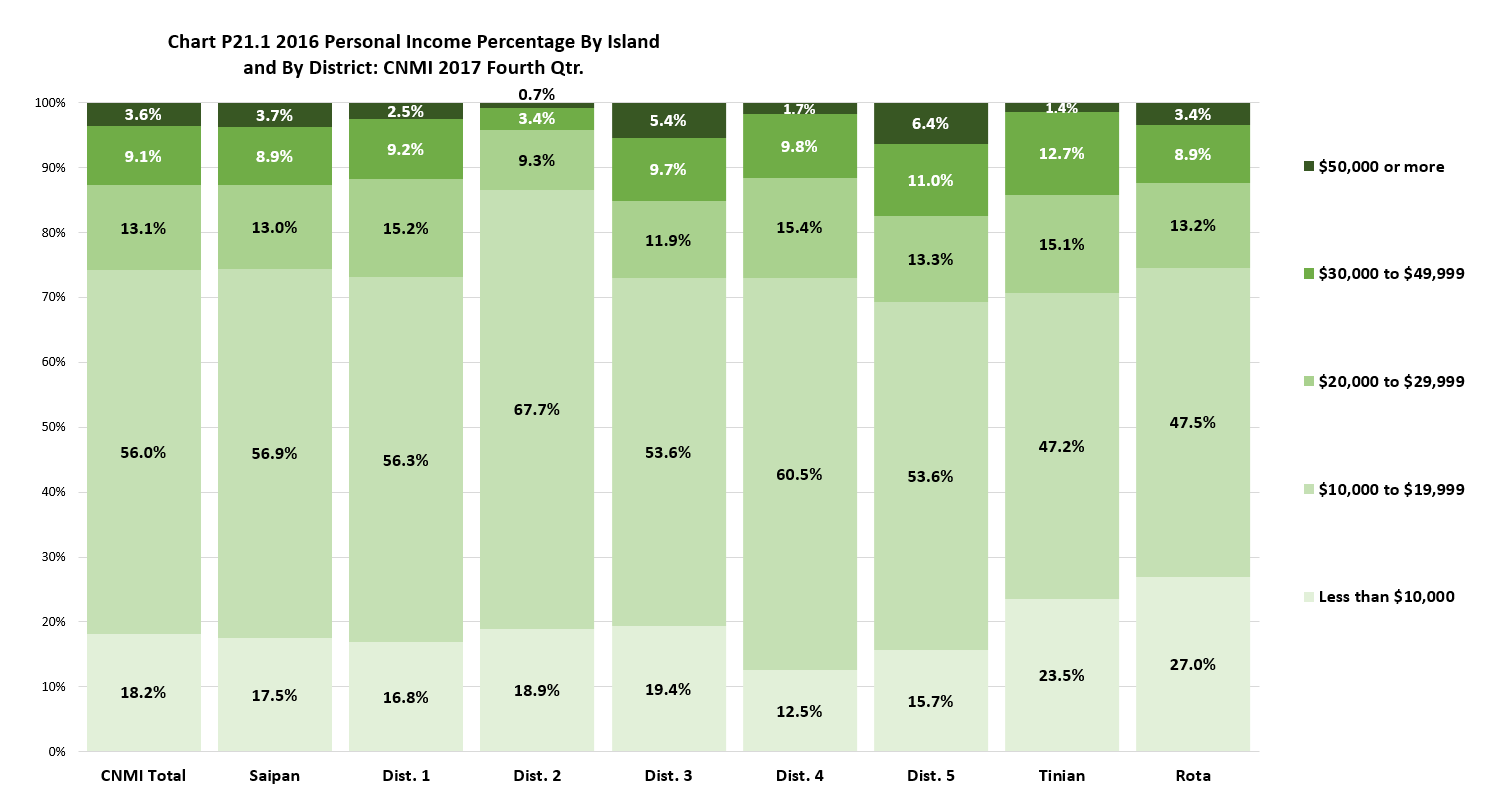
The median personal income was $13,624 while the mean was $18,362 in the CNMI at the time of the survey. Persons with less than $10,000 was 18.2% of all persons that reported personal income in 2016; persons with $10,000 to $19,999 was 56.0%; those with $20,000 to $29,999 was 13.1%; those with $30,000 to $49,000 was 9.1%; while those with $50,000 or more was 3.6%.
By Island
The median personal income was practically the same in all three islands: $14,000 in Tinian, $13,600 in Saipan, and $13,662 in Rota. The mean personal income was slightly higher in Saipan ($18,744) than in Rota ($17,722) and in Tinian ($16,964). The percentage of persons with personal income of less than $10,000 was higher in Rota (27.0%) than in Tinian (23.5%) and in Saipan (17.5%). The percentage with personal income of $10,000 to $19,999 was higher in Saipan (56.9%) while practically the same in Rota (47.5%) and Tinian (47.2%). The percentage with personal income of $20,000 to $29,999 was practically the same in Saipan (15.2%) and in Tinian (15.1%) and lower in Rota (13.2%). The percentage of those with $30,000 to $49,999 was higher in Tinian (12.7%) while the same in Saipan and in Rota (both 8.9%). The percentage of those with personal income of $50,000 or more was practically the same in Saipan (3.7%) and in Rota (3.4%) and lower in Tinian (1.4%).
By Saipan Districts
The median personal income was highest in District 5 ($14,580) and lowest in District 2 ($12,000), while the mean personal income was highest in District 4 ($20,272) and was lowest in District 2 ($13,505). The percentage of persons with personal income of less than $10,000 was highest in 2 (18.9%) and was lowest in District 4 (12.5%). The percentage of persons with personal income of $10,000 to $19,999 was highest in District 2 (67.7%) and was lowest in Districts 3 and 5 (both 53.6%). The percentage of persons with personal income of $20,000 to $29,999 was highest in District 4 (15.4%) and was lowest in District 2 (9.3%). The percentage of persons with personal income of $30,000 to $49,999 was highest in District 5 (11.0%) and was lowest in District 2 (3.4%). The percentage of persons with personal income of $50,000 or more was highest in District 5 (6.4%) and was lowest in District 2 (0.7%).
CNMI Total
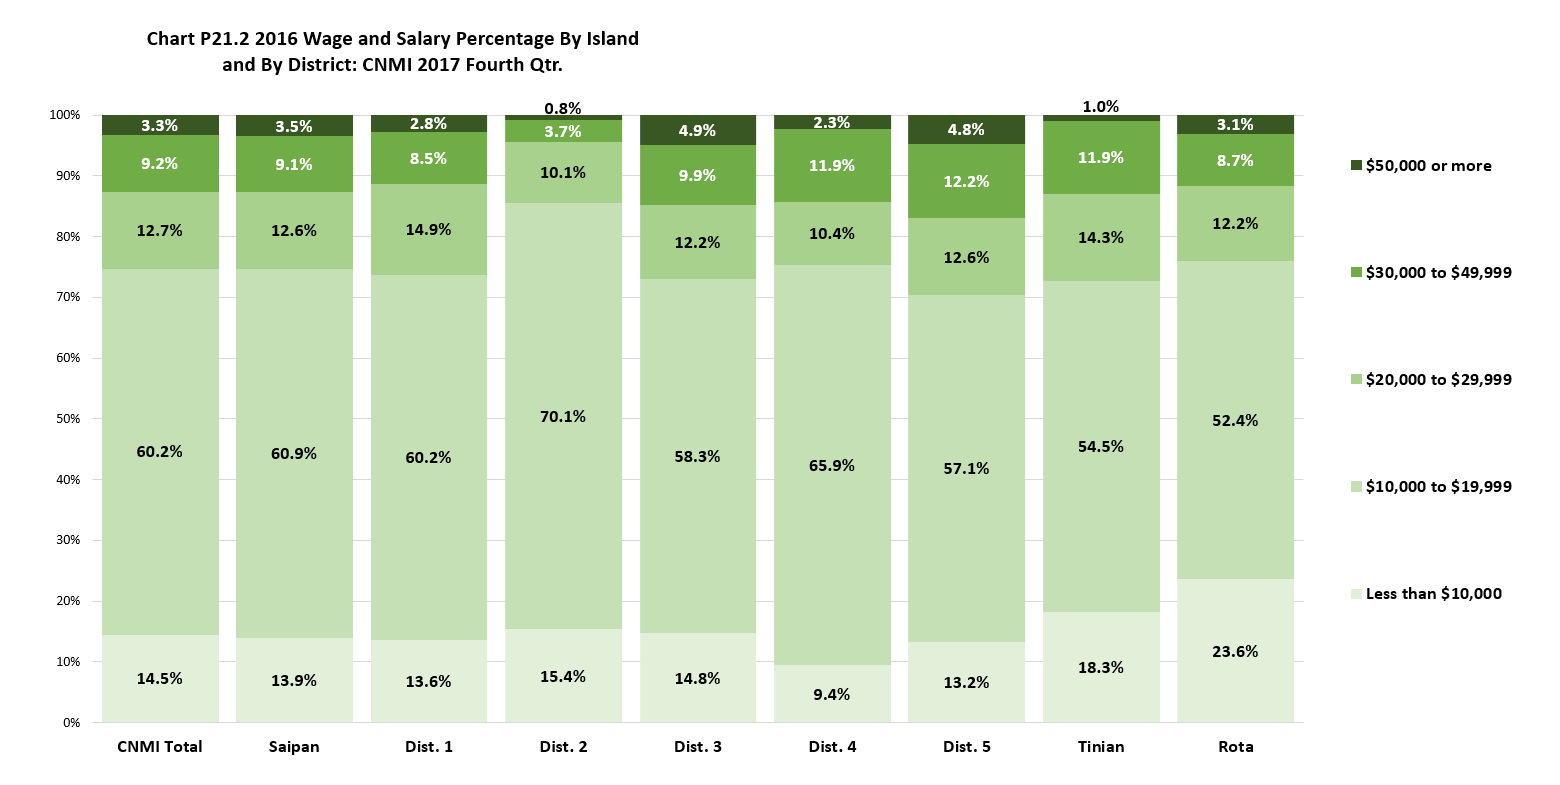
The median wage and salary income was $13,920 while the mean was $18,310 in the CNMI at the time of the survey. Persons with wage and salary of less than $10,000 was 14.5% of all persons that reported wage and salary income in 2016; the percentage of persons with wage and salary of $10,000 to $19,999 was 60.2.0%; those with $20,000 to $29,999 was 12.7%; those with $30,000 to $49,000 was 9.2%; while those with $50,000 or more was 3.3%.
By Island
The median wage and salary income was practically the same in all three islands: $14,000 in Tinian, $13,800 in Saipan, and $13,624 in Rota. The mean wage and salary income was slightly higher in Saipan ($18,621) than in Tinian ($17,478) and in Rota ($17,322). The percentage of persons with wage and salary income of less than $10,000 was higher in Rota (23.6%) than in Tinian (18.3%) and in Saipan (13.9%). The percentage with wage and salary income of $10,000 to $19,999 was higher in Saipan (60.9%) than in Tinian (54.5%) and in Rota (52.4%). The percentage of those with $20,000 to $29,999 was higher in Tinian (14.3%) while practically the same in Saipan (12.6%) and in Rota (12.2%). The percentage of those with $30,000 to $49,999 was higher in Tinian (11.9%) than in Saipan (9.1%) and in Rota (8.7%). The percentage of those with wage and salary income of $50,000 or more was higher in Saipan (3.5%) than in Rota (3.1%) and was lower in Tinian (1.0%).
By Saipan Districts
The median wage and salary income was highest in District 5 ($15,000) and lowest in District 2 ($12,576), while the mean was highest in District 5 ($20,684) and was lowest in District 2 ($14,433). The percentage of persons with wage and salary income of less than $10,000 was highest in District 2 (15.4%) and was lowest in District 4 (9.4%). The percentage of persons with wage and salary income of $10,000 to $19,999 was highest in District 2 (70.1%) and was lowest in District 5 (57.1%). The percentage of persons with personal income of $20,000 to $29,999 was highest in District 1 (14.9%) and was lowest in District 2 (10.1%). The percentage of persons with wage and salary income of $30,000 to $49,999 was highest in District 5 (12.2%) and was lowest in District 2 (3.7%). The percentage of persons with personal income of $50,000 or more was highest in District 3 (4.9%) and was lowest in District 2 (0.8%).
CNMI Total
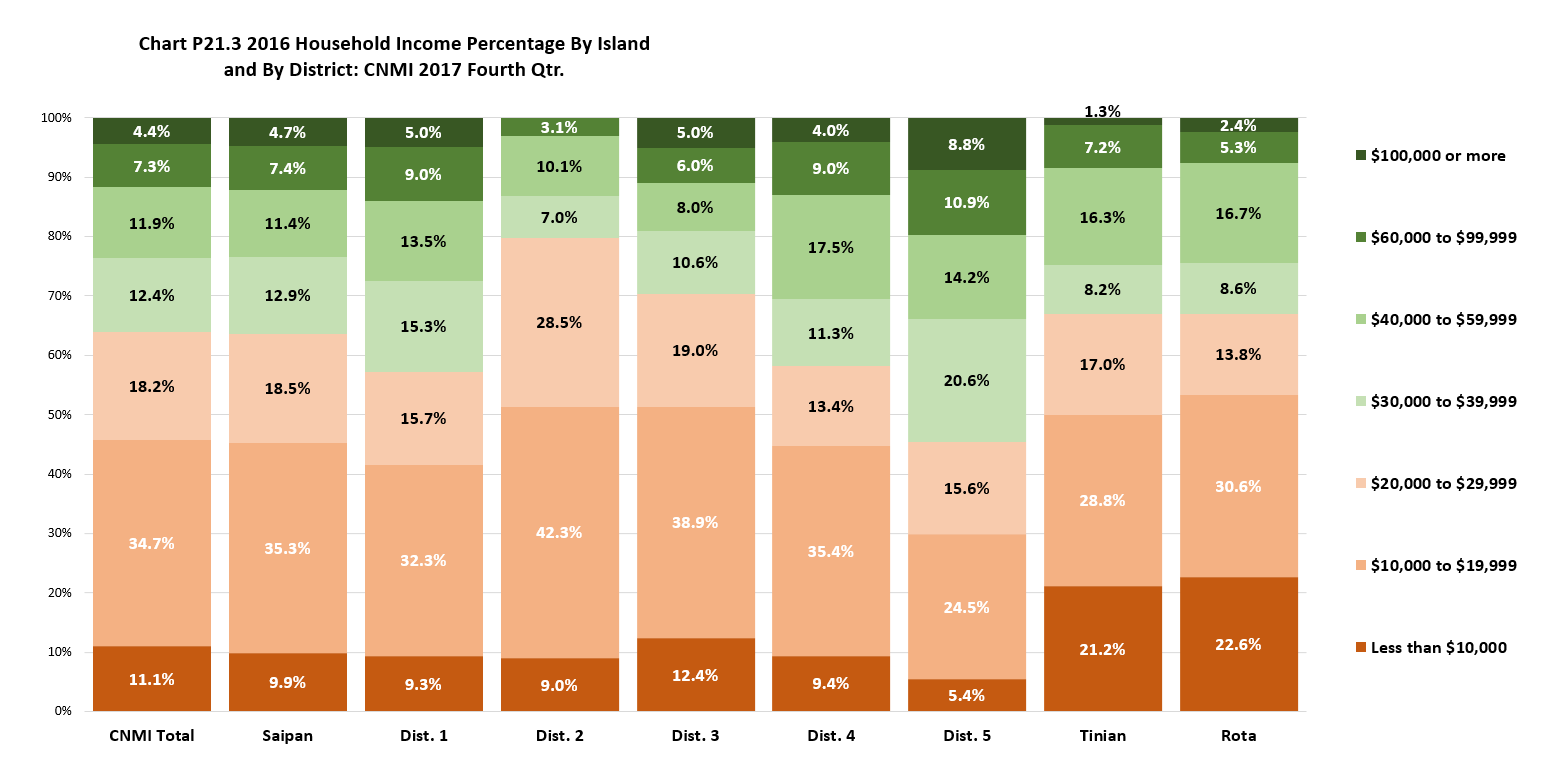
The median household income was $21,600 while the mean was $31,603 in the CNMI at the time of the survey. Households with income of less than $10,000 was 11.1% of all households that reported income in 2016; the percentage of households with income of $10,000 to $19,999 was 34.7%; those with $20,000 to $29,999 was 18.2%; those with $30,000 to $39,999 was 12.4%; those with $40,000 to $59,999 was 11.9%; those with $60,000 to $99,999 was 7.3%; while those with $100,000 or more was 4.4%.
By Island
The median household income was higher in Saipan ($22,920) than in Tinian ($20,000) and in Rota ($17,739), while the mean was higher in Saipan ($33,058) than in Rota ($28,627)) and in Tinian ($27,298). The percentage of households with income of less than $10,000 was higher in Rota (22.6%) than in Tinian (21.2%) and Saipan (11.1%). The percentage of household with income of $10,000 to $19,999 was higher in Saipan (35.3%) than in Rota (30.6%) and Tinian (28.8%). The percentage of households with income of $20,000 to $29,999 was higher in Saipan (18.5%) than in Tinian (17.0%) and in Rota (13.8%). The percentage of households with income of $30,000 to $39,999 was higher in Saipan (12.9%) than in Rota (8.6%) and in Tinian (8.2%). The percentage of households with income of $40,000 to $59,999 was higher in Rota (16.7%) and in Tinian (16.3%) and was lower in Saipan (11.4%). The percentage of households with income of $60,000 to $99,999 was higher in Saipan (7.4%) than in Tinian (7.2%) and lower in Rota (3.5%). The percentage of households with income of $100,000 or more was higher in Saipan (4.7%) than in Rota (2.4%) and Tinian (1.3%).
By Saipan Districts
The median household income was highest in District 5 ($33,932) and lowest in District 3 ($19,049), while the mean was highest in District 5 ($42,738) and was lowest in District 2 ($22,598). The percentage of households with income of less than $10,000 was highest in District 3 (12.4%) and was lowest in District 5 (5.4%). The percentage of households with income of $10,000 to $19,999 was highest in District 2 (42.3%) and was lowest in District 5 (24.5%). The percentage of households with income of $20,000 to $29,999 was highest in District 3 (28.5%) and was lowest in District 4 (13.4%). The percentage of households with income of $30,000 to $39,999 was highest in District 5 (20.6%) and was lowest in District 2 (7.0%). The percentage of households with income of $40,000 to $59,999 was highest in District 4 (17.5%) and was lowest in District 3 (8.0%). The percentage of households with income of $60,000 to $99,999 was highest in District 5 (10.9%) and was lowest in District 2 (3.1%). The percentage of households with income of $100,000 or more was highest in District 5 (8.8%) and was lowest in District 2.
Population Characteristics
Personal Income in 2016
LFS 2017 Table P21.1 2016 Personal Income by Island and by District: CNMI 2017 Fourth Qtr.
| Personal Income |
CNMI
Total |
Saipan
Total |
Saipan
Dist. 1 |
Saipan
Dist. 2 |
Saipan
Dist. 3 |
Saipan
Dist. 4 |
Saipan
Dist. 5 |
Tinian
Dist. 6 |
Rota
Dist. 7 |
|
|
|
|
|
|
|
|
|
Source: Labor Force Survey CNMI, 2017 4th Qrt. |
| Less than $10,000 |
4,298 |
3,742 |
1,066 |
562 |
1,413 |
212 |
488 |
281 |
275 |
| $10,000 to $19,999 |
13,234 |
12,185 |
3,565 |
2,019 |
3,908 |
1,025 |
1,668 |
565 |
484 |
| $20,000 to $29,999 |
3,096 |
2,780 |
962 |
277 |
867 |
261 |
413 |
181 |
135 |
| $30,000 to $39,999 |
1,606 |
1,457 |
469 |
40 |
562 |
127 |
259 |
87 |
62 |
| $40,000 to $49,999 |
542 |
447 |
115 |
61 |
147 |
39 |
85 |
65 |
29 |
| $50,000 to $74,999 |
504 |
476 |
137 |
21 |
169 |
16 |
134 |
17 |
11 |
| $75,000 + |
345 |
322 |
19 |
– |
227 |
13 |
64 |
– |
23 |
LFS 2017 Table P21.1 Median & Mean for 2016 Personal Income by Island and by District: CNMI 2017 Fourth Qtr.
| Personal Income |
CNMI
Total |
Saipan
Total |
Saipan
Dist. 1 |
Saipan
Dist. 2 |
Saipan
Dist. 3 |
Saipan
Dist. 4 |
Saipan
Dist. 5 |
Tinian
Dist. 6 |
Rota
Dist. 7 |
|
|
|
|
|
|
|
|
|
Source: Labor Force Survey CNMI, 2017 4th Qrt. |
| Median |
$13,624 |
$13,600 |
$14,400 |
$12,000 |
$12,600 |
$14,000 |
$14,580 |
$14,000 |
$13,662 |
| Mean |
$18,362 |
$18,744 |
$18,779 |
$13,505 |
$19,389 |
$20,272 |
$20,188 |
$16,964 |
$17,722 |
LFS 2017 Table P21.1 2016 Personal Income by Island and by District: CNMI 2017 Fourth Qtr. (Distribution Within)
| Personal Income |
CNMI
Total |
Saipan
Total |
Saipan
Dist. 1 |
Saipan
Dist. 2 |
Saipan
Dist. 3 |
Saipan
Dist. 4 |
Saipan
Dist. 5 |
Tinian
Dist. 6 |
Rota
Dist. 7 |
|
|
|
|
|
|
|
|
|
Source: Labor Force Survey CNMI, 2017 4th Qrt. |
| Less than $10,000 |
18.2% |
17.5% |
16.8% |
18.9% |
19.4% |
12.5% |
15.7% |
23.5% |
27.0% |
| $10,000 to $19,999 |
56.0% |
56.9% |
56.3% |
67.7% |
53.6% |
60.5% |
53.6% |
47.2% |
47.5% |
| $20,000 to $29,999 |
13.1% |
13.0% |
15.2% |
9.3% |
11.9% |
15.4% |
13.3% |
15.1% |
13.2% |
| $30,000 to $39,999 |
6.8% |
6.8% |
7.4% |
1.3% |
7.7% |
7.5% |
8.3% |
7.3% |
6.0% |
| $40,000 to $49,999 |
2.3% |
2.1% |
1.8% |
2.0% |
2.0% |
2.3% |
2.7% |
5.5% |
2.9% |
| $50,000 to $74,999 |
2.1% |
2.2% |
2.2% |
0.7% |
2.3% |
0.9% |
4.3% |
1.4% |
1.1% |
| $75,000 + |
1.5% |
1.5% |
0.3% |
0.0% |
3.1% |
0.8% |
2.1% |
0.0% |
2.3% |
LFS 2017 Table P21.1 2016 Personal Income by Island and by District: CNMI 2017 Fourth Qtr. (Distribution Amoung)
| Personal Income |
CNMI
Total |
Saipan
Total |
Saipan
Dist. 1 |
Saipan
Dist. 2 |
Saipan
Dist. 3 |
Saipan
Dist. 4 |
Saipan
Dist. 5 |
Tinian
Dist. 6 |
Rota
Dist. 7 |
|
|
|
|
|
|
|
|
|
Source: Labor Force Survey CNMI, 2017 4th Qrt. |
| Less than $10,000 |
100% |
87.1% |
24.8% |
13.1% |
32.9% |
4.9% |
11.4% |
6.5% |
6.4% |
| $10,000 to $19,999 |
100% |
92.1% |
26.9% |
15.3% |
29.5% |
7.7% |
12.6% |
4.3% |
3.7% |
| $20,000 to $29,999 |
100% |
89.8% |
31.1% |
9.0% |
28.0% |
8.4% |
13.3% |
5.8% |
4.4% |
| $30,000 to $39,999 |
100% |
90.8% |
29.2% |
2.5% |
35.0% |
7.9% |
16.1% |
5.4% |
3.8% |
| $40,000 to $49,999 |
100% |
82.6% |
21.3% |
11.3% |
27.2% |
7.2% |
15.6% |
12.0% |
5.4% |
| $50,000 to $74,999 |
100% |
94.4% |
27.1% |
4.2% |
33.5% |
3.2% |
26.5% |
3.4% |
2.2% |
| $75,000 + |
100% |
93.3% |
5.5% |
0.0% |
65.6% |
3.7% |
18.5% |
0.0% |
6.7% |
Wage and Salary in 2016
LFS 2017 Table P21.2 2016 Wage and Salary by Island and by District: CNMI 2017 Fourth Qtr.
| Wage and Salary |
CNMI
Total |
Saipan
Total |
Saipan
Dist. 1 |
Saipan
Dist. 2 |
Saipan
Dist. 3 |
Saipan
Dist. 4 |
Saipan
Dist. 5 |
Tinian
Dist. 6 |
Rota
Dist. 7 |
|
|
|
|
|
|
|
|
|
Source: Labor Force Survey CNMI, 2017 4th Qrt. |
| Less than $10,000 |
3,252 |
2,831 |
841 |
426 |
1,032 |
147 |
384 |
204 |
217 |
| $10,000 to $19,999 |
13,502 |
12,410 |
3,717 |
1,941 |
4,065 |
1,029 |
1,657 |
610 |
482 |
| $20,000 to $29,999 |
2,849 |
2,577 |
920 |
279 |
849 |
163 |
366 |
160 |
112 |
| $30,000 to $39,999 |
1,464 |
1,338 |
392 |
40 |
519 |
155 |
232 |
74 |
51 |
| $40,000 to $49,999 |
609 |
521 |
136 |
61 |
170 |
32 |
122 |
60 |
28 |
| $50,000 to $74,999 |
440 |
418 |
154 |
21 |
138 |
24 |
82 |
11 |
11 |
| $75,000 + |
310 |
292 |
19 |
– |
204 |
13 |
57 |
– |
17 |
LFS 2017 Table P21.2 Median & Mean for 2016 Wage and Salary by Island and by District: CNMI 2017 Fourth Qtr.
| Wage and Salary |
CNMI
Total |
Saipan
Total |
Saipan
Dist. 1 |
Saipan
Dist. 2 |
Saipan
Dist. 3 |
Saipan
Dist. 4 |
Saipan
Dist. 5 |
Tinian
Dist. 6 |
Rota
Dist. 7 |
|
|
|
|
|
|
|
|
|
Source: Labor Force Survey CNMI, 2017 4th Qrt. |
| Median |
$13,920 |
$13,800 |
$14,976 |
$12,576 |
$13,000 |
$13,910 |
$15,000 |
$14,000 |
$13,624 |
| Mean |
$18,310 |
$18,621 |
$17,745 |
$14,433 |
$20,213 |
$18,536 |
$20,684 |
$17,478 |
$17,322 |
LFS 2017 Table P21.2 2016 Wage and Salary by Island and by District: CNMI 2017 Fourth Qtr. (Distribution Within)
| Wage and Salary |
CNMI
Total |
Saipan
Total |
Saipan
Dist. 1 |
Saipan
Dist. 2 |
Saipan
Dist. 3 |
Saipan
Dist. 4 |
Saipan
Dist. 5 |
Tinian
Dist. 6 |
Rota
Dist. 7 |
|
|
|
|
|
|
|
|
|
Source: Labor Force Survey CNMI, 2017 4th Qrt. |
| Less than $10,000 |
14.5% |
13.9% |
13.6% |
15.4% |
14.8% |
9.4% |
13.2% |
18.3% |
23.6% |
| $10,000 to $19,999 |
60.2% |
60.9% |
60.2% |
70.1% |
58.3% |
65.9% |
57.1% |
54.5% |
52.4% |
| $20,000 to $29,999 |
12.7% |
12.6% |
14.9% |
10.1% |
12.2% |
10.4% |
12.6% |
14.3% |
12.2% |
| $30,000 to $39,999 |
6.5% |
6.6% |
6.3% |
1.4% |
7.4% |
9.9% |
8.0% |
6.6% |
5.6% |
| $40,000 to $49,999 |
2.7% |
2.6% |
2.2% |
2.2% |
2.4% |
2.0% |
4.2% |
5.3% |
3.1% |
| $50,000 to $74,999 |
2.0% |
2.0% |
2.5% |
0.8% |
2.0% |
1.5% |
2.8% |
1.0% |
1.2% |
| $75,000 + |
1.4% |
1.4% |
0.3% |
0.0% |
2.9% |
0.8% |
2.0% |
0.0% |
1.9% |
LFS 2017 Table P21.2 2016 Wage and Salary by Island and by District: CNMI 2017 Fourth Qtr. (Distribution Amoung)
| Wage and Salary |
CNMI
Total |
Saipan
Total |
Saipan
Dist. 1 |
Saipan
Dist. 2 |
Saipan
Dist. 3 |
Saipan
Dist. 4 |
Saipan
Dist. 5 |
Tinian
Dist. 6 |
Rota
Dist. 7 |
|
|
|
|
|
|
|
|
|
Source: Labor Force Survey CNMI, 2017 4th Qrt. |
| Less than $10,000 |
100% |
87.0% |
25.9% |
13.1% |
31.7% |
4.5% |
11.8% |
6.3% |
6.7% |
| $10,000 to $19,999 |
100% |
91.9% |
27.5% |
14.4% |
30.1% |
7.6% |
12.3% |
4.5% |
3.6% |
| $20,000 to $29,999 |
100% |
90.4% |
32.3% |
9.8% |
29.8% |
5.7% |
12.9% |
5.6% |
3.9% |
| $30,000 to $39,999 |
100% |
91.4% |
26.8% |
2.7% |
35.5% |
10.6% |
15.9% |
5.0% |
3.5% |
| $40,000 to $49,999 |
100% |
85.6% |
22.4% |
10.0% |
27.9% |
5.2% |
20.0% |
9.8% |
4.7% |
| $50,000 to $74,999 |
100% |
94.9% |
35.0% |
4.8% |
31.2% |
5.3% |
18.6% |
2.6% |
2.5% |
| $75,000 + |
100% |
94.5% |
6.1% |
0.0% |
65.8% |
4.1% |
18.4% |
0.0% |
5.5% |
Household Income in 2016
LFS 2017 Table P21.3 2016 Household Income by Island and by District: CNMI 2017 Fourth Qtr.
| Wage and Salary |
CNMI
Total |
Saipan
Total |
Saipan
Dist. 1 |
Saipan
Dist. 2 |
Saipan
Dist. 3 |
Saipan
Dist. 4 |
Saipan
Dist. 5 |
Tinian
Dist. 6 |
Rota
Dist. 7 |
|
|
|
|
|
|
|
|
|
Source: Labor Force Survey CNMI, 2017 4th Qrt. |
| Less than $10,000 |
1,788 |
1,437 |
395 |
178 |
658 |
103 |
103 |
187 |
165 |
| $10,000 to $19,999 |
5,602 |
5,125 |
1,374 |
834 |
2,064 |
387 |
466 |
254 |
223 |
| $20,000 to $29,999 |
2,933 |
2,683 |
668 |
562 |
1,010 |
146 |
297 |
150 |
100 |
| $30,000 to $39,999 |
2,003 |
1,868 |
651 |
138 |
563 |
124 |
392 |
73 |
62 |
| $40,000 to $49,999 |
1,206 |
1,044 |
354 |
120 |
276 |
136 |
157 |
101 |
61 |
| $50,000 to $74,999 |
1,571 |
1,401 |
542 |
119 |
394 |
88 |
259 |
87 |
82 |
| $75,000 or more |
1,037 |
972 |
273 |
21 |
338 |
110 |
230 |
31 |
34 |
| Zero or no response |
567 |
514 |
76 |
79 |
219 |
28 |
112 |
17 |
36 |
LFS 2017 Table P21.3 Median & Mean 2016 Household Income by Island and by District: CNMI 2017 Fourth Qtr.
| Wage and Salary |
CNMI
Total |
Saipan
Total |
Saipan
Dist. 1 |
Saipan
Dist. 2 |
Saipan
Dist. 3 |
Saipan
Dist. 4 |
Saipan
Dist. 5 |
Tinian
Dist. 6 |
Rota
Dist. 7 |
|
|
|
|
|
|
|
|
|
Source: Labor Force Survey CNMI, 2017 4th Qrt. |
| Median |
$20,950 |
$21,869 |
$24,000 |
$19,000 |
$18,000 |
$27,000 |
$30,672 |
$20,000 |
$17,000 |
| Mean |
$30,643 |
$32,032 |
$33,803 |
$21,737 |
$28,618 |
$38,086 |
$41,198 |
$26,835 |
$27,364 |
LFS 2017 Table P21.3 2016 Household Income by Island and by District: CNMI 2017 Fourth Qtr. (Distribution Within)
| Wage and Salary |
CNMI
Total |
Saipan
Total |
Saipan
Dist. 1 |
Saipan
Dist. 2 |
Saipan
Dist. 3 |
Saipan
Dist. 4 |
Saipan
Dist. 5 |
Tinian
Dist. 6 |
Rota
Dist. 7 |
|
|
|
|
|
|
|
|
|
Source: Labor Force Survey CNMI, 2017 4th Qrt. |
| Less than $10,000 |
11.1% |
9.9% |
9.3% |
9.0% |
12.4% |
9.4% |
5.4% |
21.2% |
22.6% |
| $10,000 to $19,999 |
34.7% |
35.3% |
32.3% |
42.3% |
38.9% |
35.4% |
24.5% |
28.8% |
30.6% |
| $20,000 to $29,999 |
18.2% |
18.5% |
15.7% |
28.5% |
19.0% |
13.4% |
15.6% |
17.0% |
13.8% |
| $30,000 to $39,999 |
12.4% |
12.9% |
15.3% |
7.0% |
10.6% |
11.3% |
20.6% |
8.2% |
8.6% |
| $40,000 to $49,999 |
7.5% |
7.2% |
8.3% |
6.1% |
5.2% |
12.4% |
8.3% |
11.5% |
8.3% |
| $50,000 to $74,999 |
9.7% |
9.6% |
12.7% |
6.0% |
7.4% |
8.0% |
13.6% |
9.9% |
11.3% |
| $75,000 or more |
6.4% |
6.7% |
6.4% |
1.1% |
6.4% |
10.1% |
12.1% |
3.5% |
4.7% |
LFS 2017 Table P21.3 2016 Household Income by Island and by District: CNMI 2017 Fourth Qtr. (Distribution Amoung)
| Wage and Salary |
CNMI
Total |
Saipan
Total |
Saipan
Dist. 1 |
Saipan
Dist. 2 |
Saipan
Dist. 3 |
Saipan
Dist. 4 |
Saipan
Dist. 5 |
Tinian
Dist. 6 |
Rota
Dist. 7 |
|
|
|
|
|
|
|
|
|
Source: Labor Force Survey CNMI, 2017 4th Qrt. |
| Less than $10,000 |
100% |
90.0% |
26.4% |
12.2% |
32.9% |
6.8% |
11.8% |
5.5% |
4.5% |
| $10,000 to $19,999 |
100% |
80.4% |
22.1% |
10.0% |
36.8% |
5.8% |
5.8% |
10.4% |
9.2% |
| $20,000 to $29,999 |
100% |
91.5% |
24.5% |
14.9% |
36.8% |
6.9% |
8.3% |
4.5% |
4.0% |
| $30,000 to $39,999 |
100% |
91.5% |
22.8% |
19.2% |
34.4% |
5.0% |
10.1% |
5.1% |
3.4% |
| $40,000 to $49,999 |
100% |
93.2% |
32.5% |
6.9% |
28.1% |
6.2% |
19.6% |
3.6% |
3.1% |
| $50,000 to $74,999 |
100% |
86.6% |
29.4% |
10.0% |
22.9% |
11.2% |
13.0% |
8.4% |
5.0% |
| $75,000 or more |
100% |
89.2% |
34.5% |
7.6% |
25.1% |
5.6% |
16.5% |
5.5% |
5.2% |
Population Characteristics
To download, right click on the chart and select “Save Image As”…