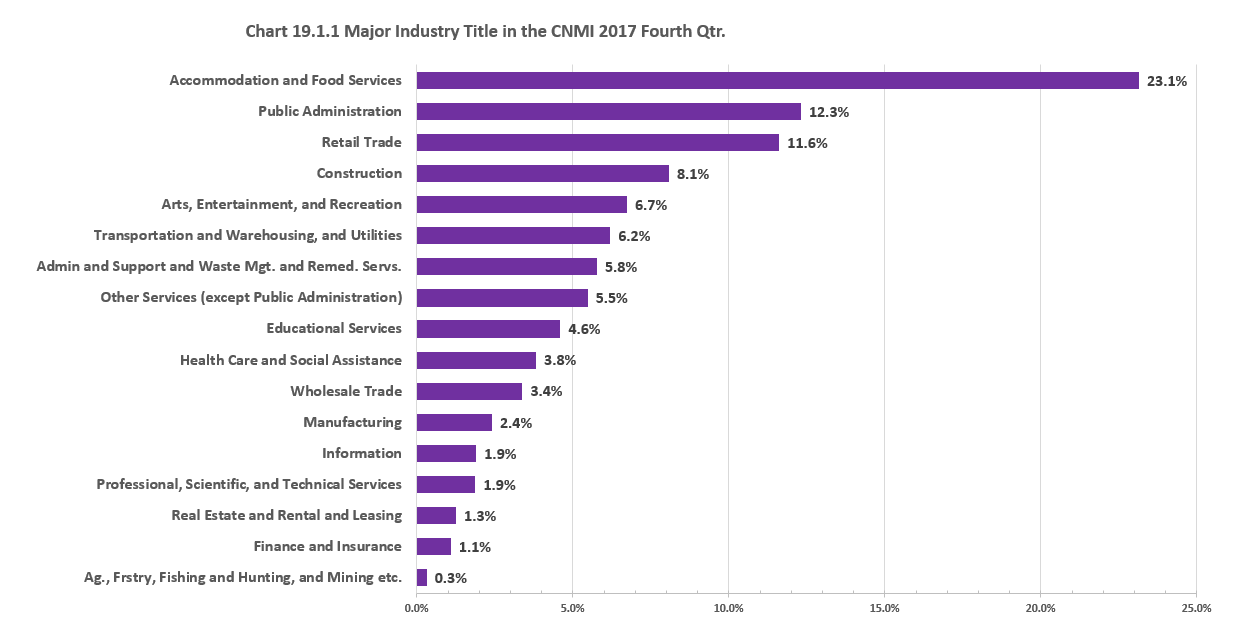
CNMI Total
The Accommodation and Food Services, with 23.1% of total persons that reported they worked in 2017 or last worked since 2012, was the largest industry in the CNMI in 2017. Public Administration was the second largest industry (12.3%), followed by Retail Trade (11.6%), Construction (8.1%), etc. The smallest industry was the Agriculture, Forestry, Fishing, and Mining (0.3%).
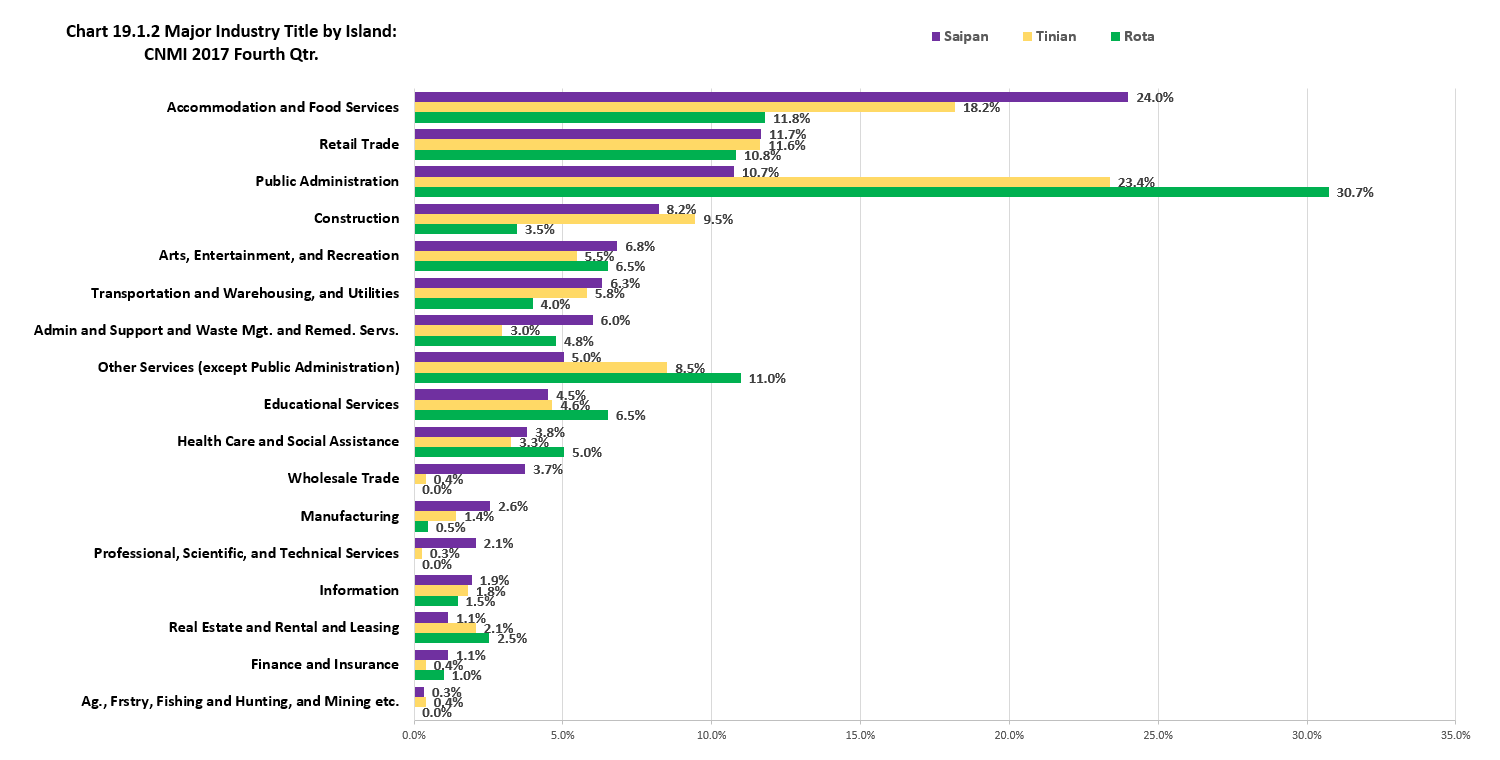
By Island
In Saipan, Accommodation and Food Services, with 24.0% of total persons that reported they worked in 2017 or last worked since 2012, was the largest industry. Retail Trade was the second largest (11.7%), followed by Public Administration (10.7%), Construction (8.2%), etc. The smallest industry in Saipan was the Agriculture, Forestry, Fishing, and Mining (0.3%).
In Tinian, Public Administration, with 23.4% of total persons that reported they worked in 2017 or last worked since 2012, was the largest industry. Accommodation and Food Services was the second largest industry (18.2%), followed by Retail Trade (11.6%), Construction (9.5%), etc. The smallest industry in Tinian was the Professional, Scientific, and Technical Services (0.3%).
In Rota, Public Administration with, 30.7% of the total persons that reported they worked in 2017 or last worked since 2012, was the largest industry. Accommodation and Food Services was the second largest industry (11.8%), followed by Other Services (except Public Administration) (11.0%), Retail Trade (10.8%), Education Services and Arts, Entertainment, Recreation (both 6.5%).
By Saipan Districts
There were no reliable estimates of major industry by Districts within Saipan.
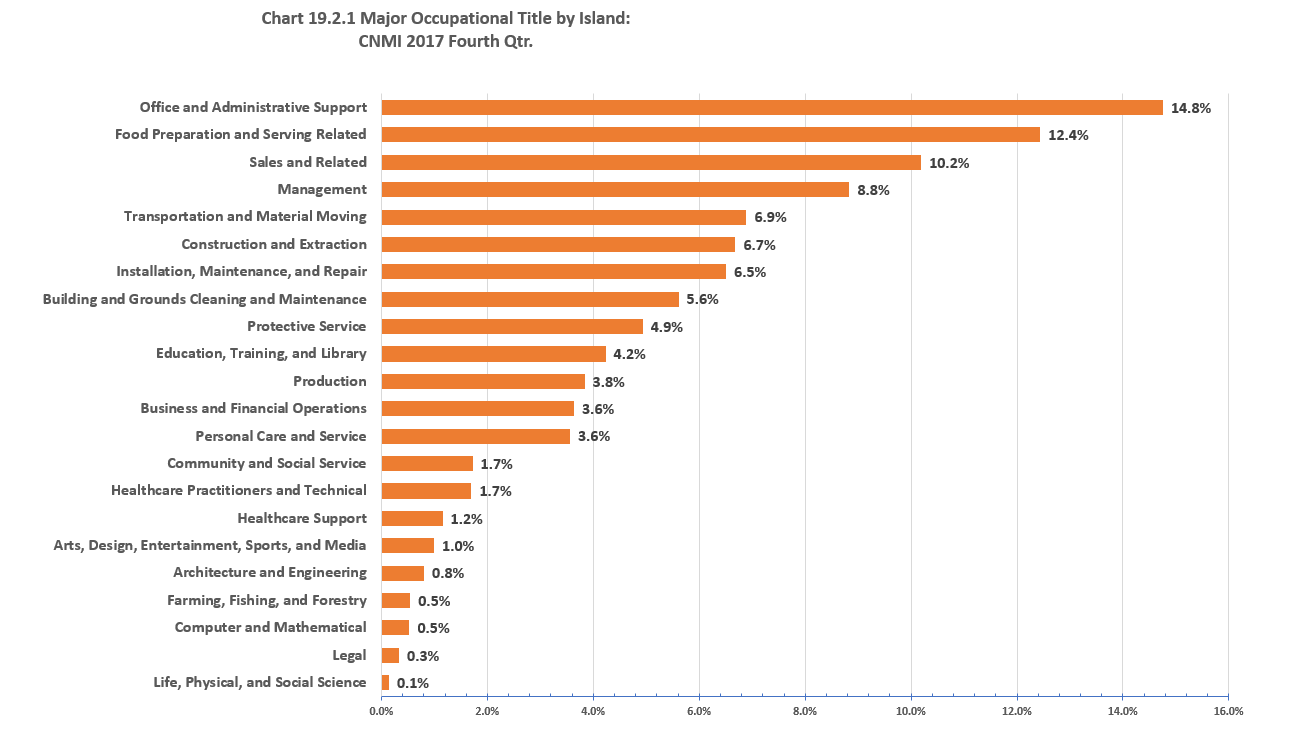
CNMI Total
The Office and Administrative Support Occupations, with 14.8% of total persons that reported they worked in 2017 or last worked since 2012, was the largest major occupational group in the CNMI at the time of the survey. The Food Preparation and Serving Related Occupations was the second largest (12.4%), followed by Sales and Related Occupations (10.2%), Management Occupations (8.8%), etc. The smallest occupational group was the Life, Physical, and Social Science Occupations (0.1%).
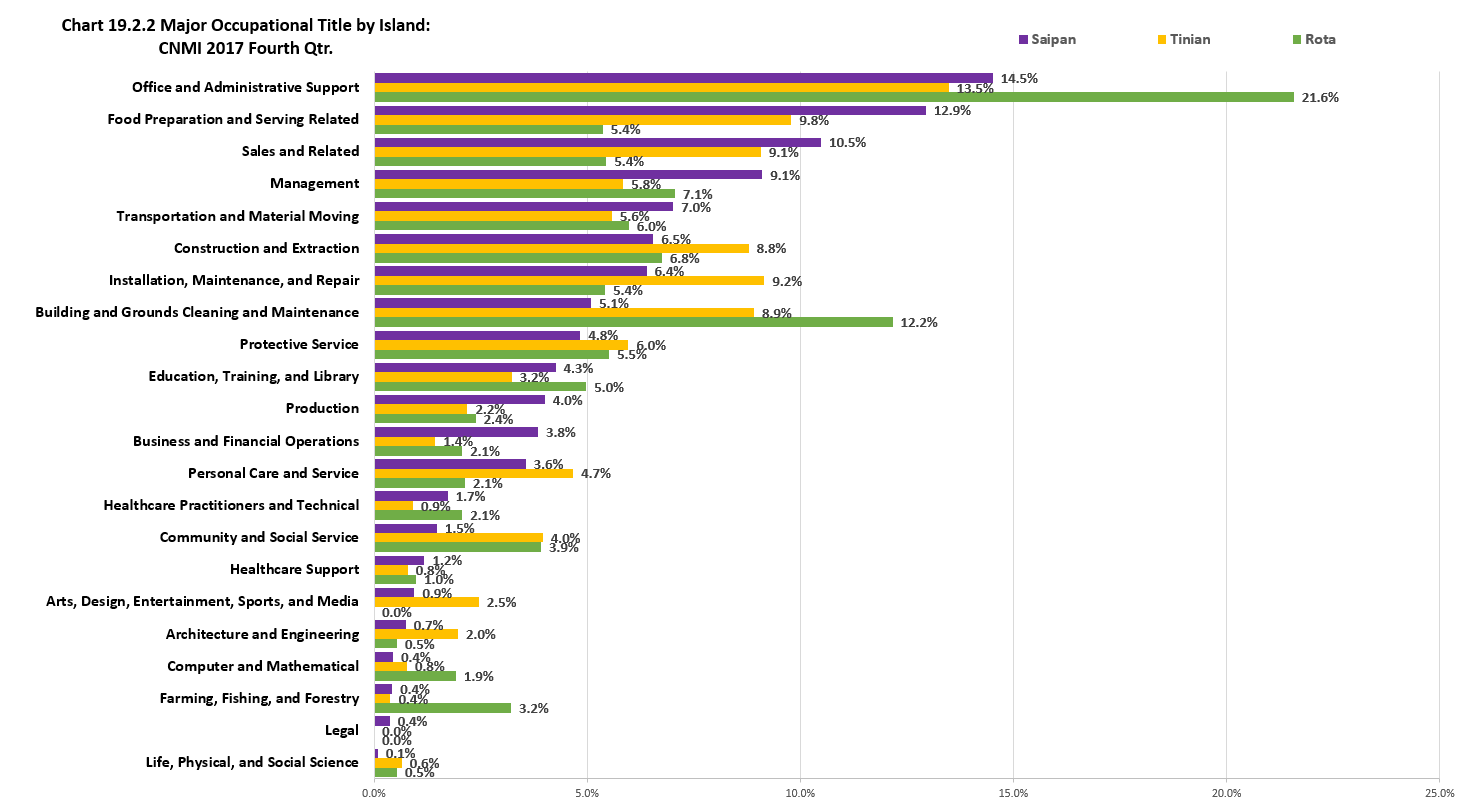
By Island
In Saipan, the Office and Administrative Support Occupations was the largest major occupational group with 14.5% of the total persons that reported they worked in 2017 or last worked since 2012. The Food Preparation and Serving Related Occupations was the second largest (12.9%), followed by Sales and Related Occupations (10.5%), Management Occupations (9.1%), etc. The smallest occupational group was the Life, Physical, and Social Science Occupations (0.1%).
In Tinian, The Office and Administrative Support Occupations was the largest major occupational group with 13.5% of the total persons that reported they worked in 2017 or last worked since 2012. The Food Preparation and Serving Related Occupations was the second largest (9.8%), followed by Installation, Maintenance, and Repair Occupations (9.2%), Sales and Related Occupations (9.1%), etc. The smallest occupational group was the Legal Occupations.
In Rota, the Office and Administrative Support Occupations was the largest major occupational group with 21.6% of the total persons that reported they worked in 2017 or last worked since 2012. The Building and Grounds Cleaning and Maintenance Occupations was the second largest (12.2%), followed by Management Occupations (7.1%), Construction and Extraction Occupations (6.8%), etc. The smallest occupational group was the Legal Occupations.
By Saipan Districts
There were no reliable estimates of major occupation by Districts within Saipan.
CNMI Total
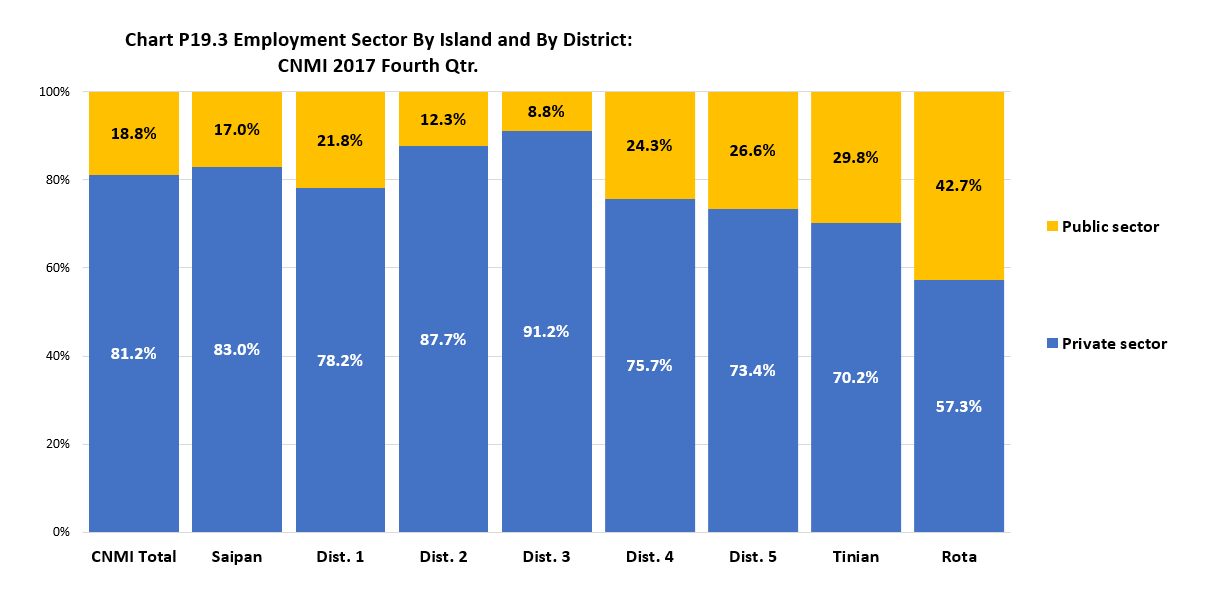
Persons employed in the private sector was 81.2% of the total persons that reported they worked in 2017 or last worked since 2012, while 18.8% was employed in the public sector.
By Island
The percentage of employees that worked in the private sector was higher in Saipan (83.0%) than in Tinian (70.2%) and was lower in Rota (57.3%).
By Saipan Districts
The percentage of employees that worked in the private sector was highest in District 3 (91.2%) and was lowest in District 5 (73.4%).
Population Characteristics
Major Industry
LFS 2017 Table P19.1 Major Industy by Island: CNMI 2017 Fourth Qtr.
| Major Industry |
CNMI
Total |
Saipan |
Tinian |
Rota |
|
|
|
|
Source: Labor Force Survey CNMI, 2017 4th Qrt. |
| Ag., Frstry, Fishing and Hunting, and Mining etc. |
83 |
77 |
6 |
– |
| Construction |
2,115 |
1,937 |
139 |
39 |
| Manufacturing |
630 |
603 |
21 |
5 |
| Wholesale Trade |
885 |
880 |
6 |
– |
| Retail Trade |
3,041 |
2,748 |
172 |
121 |
| Transportation and Warehousing, and Utilities |
1,621 |
1,491 |
86 |
45 |
| Information |
498 |
455 |
27 |
16 |
| Finance and Insurance |
285 |
268 |
6 |
11 |
| Real Estate and Rental and Leasing |
329 |
270 |
31 |
28 |
| Professional, Scientific, and Technical Services |
491 |
488 |
4 |
– |
| Educational Services |
1,204 |
1,062 |
69 |
73 |
| Health Care and Social Assistance |
1,000 |
896 |
48 |
56 |
| Arts, Entertainment, and Recreation |
1,763 |
1,609 |
81 |
73 |
| Accommodation and Food Services |
6,057 |
5,657 |
268 |
132 |
| Other Services (except Public Administration) |
1,433 |
1,184 |
126 |
123 |
| Public Administration |
3,221 |
2,532 |
345 |
344 |
LFS 2017 Table P19.1 Major Industy by Island: CNMI 2017 Fourth Qtr. (Distribution Within)
| Major Industry |
CNMI
Total |
Saipan |
Tinian |
Rota |
|
|
|
|
Source: Labor Force Survey CNMI, 2017 4th Qrt. |
| Ag., Frstry, Fishing and Hunting, and Mining etc. |
0.3% |
0.3% |
0.4% |
0.0% |
| Construction |
8.6% |
8.7% |
9.7% |
3.6% |
| Manufacturing |
2.6% |
2.7% |
1.5% |
0.5% |
| Wholesale Trade |
3.6% |
4.0% |
0.4% |
0.0% |
| Retail Trade |
12.3% |
12.4% |
12.0% |
11.4% |
| Transportation and Warehousing, and Utilities |
6.6% |
6.7% |
6.0% |
4.2% |
| Information |
2.0% |
2.1% |
1.9% |
1.5% |
| Finance and Insurance |
1.2% |
1.2% |
0.4% |
1.0% |
| Real Estate and Rental and Leasing |
1.3% |
1.2% |
2.1% |
2.7% |
| Professional, Scientific, and Technical Services |
2.0% |
2.2% |
0.3% |
0.0% |
| Educational Services |
4.9% |
4.8% |
4.8% |
6.8% |
| Health Care and Social Assistance |
4.1% |
4.0% |
3.4% |
5.3% |
| Arts, Entertainment, and Recreation |
7.1% |
7.3% |
5.6% |
6.8% |
| Accommodation and Food Services |
24.6% |
25.5% |
18.7% |
12.4% |
| Other Services (except Public Administration) |
5.8% |
5.3% |
8.8% |
11.5% |
| Public Administration |
13.1% |
11.4% |
24.1% |
32.3% |
LFS 2017 Table P19.1 Major Industy by Island: CNMI 2017 Fourth Qtr. (Distribution Amoung)
| Major Industry |
CNMI
Total |
Saipan |
Tinian |
Rota |
|
|
|
|
Source: Labor Force Survey CNMI, 2017 4th Qrt. |
| Ag., Frstry, Fishing and Hunting, and Mining etc. |
100% |
93.1% |
6.9% |
0.0% |
| Construction |
100% |
91.6% |
6.6% |
1.8% |
| Manufacturing |
100% |
95.8% |
3.3% |
0.8% |
| Wholesale Trade |
100% |
99.4% |
0.6% |
0.0% |
| Retail Trade |
100% |
90.4% |
5.6% |
4.0% |
| Transportation and Warehousing, and Utilities |
100% |
92.0% |
5.3% |
2.7% |
| Information |
100% |
91.4% |
5.3% |
3.3% |
| Finance and Insurance |
100% |
94.1% |
2.0% |
3.9% |
| Real Estate and Rental and Leasing |
100% |
82.1% |
9.3% |
8.6% |
| Professional, Scientific, and Technical Services |
100% |
99.2% |
0.8% |
0.0% |
| Educational Services |
100% |
88.2% |
5.7% |
6.1% |
| Health Care and Social Assistance |
100% |
89.5% |
4.8% |
5.6% |
| Arts, Entertainment, and Recreation |
100% |
91.3% |
4.6% |
4.1% |
| Accommodation and Food Services |
100% |
93.4% |
4.4% |
2.2% |
| Other Services (except Public Administration) |
100% |
82.7% |
8.8% |
8.6% |
| Public Administration |
100% |
78.6% |
10.7% |
10.7% |
Major Occupational Title
LFS 2017 Table P19.2 Occupational Title by Island and District: CNMI 2017 Fourth Qtr.
| Major Occupational Title |
CNMI
Total |
Saipan |
Tinian |
Rota |
|
|
|
|
Source: Labor Force Survey CNMI, 2017 4th Qrt. |
| Management |
2,312 |
2,147 |
86 |
79 |
| Business and Financial Operations |
951 |
907 |
21 |
23 |
| Computer and Mathematical |
138 |
105 |
11 |
22 |
| Architecture and Engineering |
210 |
175 |
29 |
6 |
| Life, Physical, and Social Science |
36 |
21 |
10 |
6 |
| Community and Social Service |
450 |
348 |
58 |
44 |
| Legal |
86 |
86 |
– |
– |
| Education, Training, and Library |
1,107 |
1,004 |
48 |
56 |
| Arts, Design, Entertainment, Sports, and Media |
260 |
223 |
36 |
– |
| Healthcare Practitioners and Technical |
444 |
407 |
13 |
23 |
| Healthcare Support |
302 |
279 |
12 |
11 |
| Protective Service |
1,291 |
1,141 |
88 |
62 |
| Food Preparation and Serving Related |
3,255 |
3,051 |
144 |
60 |
| Building and Grounds Cleaning and Maintenance |
1,468 |
1,200 |
131 |
136 |
| Personal Care and Service |
931 |
838 |
69 |
24 |
| Sales and Related |
2,666 |
2,471 |
134 |
61 |
| Office and Administrative Support |
3,861 |
3,420 |
199 |
242 |
| Farming, Fishing, and Forestry |
142 |
100 |
6 |
36 |
| Construction and Extraction |
1,749 |
1,543 |
130 |
76 |
| Installation, Maintenance, and Repair |
1,702 |
1,506 |
135 |
61 |
| Production |
1,003 |
944 |
32 |
27 |
| Transportation and Material Moving |
1,803 |
1,654 |
82 |
67 |
LFS 2017 Table P19.2 Occupational Title by Island and District: CNMI 2017 Fourth Qtr. (Distribution Within)
| Major Occupational Title |
CNMI
Total |
Saipan |
Tinian |
Rota |
|
|
|
|
Source: Labor Force Survey CNMI, 2017 4th Qrt. |
| Management |
8.8% |
9.1% |
5.8% |
7.1% |
| Business and Financial Operations |
3.6% |
3.8% |
1.4% |
2.1% |
| Computer and Mathematical |
0.5% |
0.4% |
0.8% |
1.9% |
| Architecture and Engineering |
0.8% |
0.7% |
2.0% |
0.5% |
| Life, Physical, and Social Science |
0.1% |
0.1% |
0.6% |
0.5% |
| Community and Social Service |
1.7% |
1.5% |
4.0% |
3.9% |
| Legal |
0.3% |
0.4% |
0.0% |
0.0% |
| Education, Training, and Library |
4.2% |
4.3% |
3.2% |
5.0% |
| Arts, Design, Entertainment, Sports, and Media |
1.0% |
0.9% |
2.5% |
0.0% |
| Healthcare Practitioners and Technical |
1.7% |
1.7% |
0.9% |
2.1% |
| Healthcare Support |
1.2% |
1.2% |
0.8% |
1.0% |
| Protective Service |
4.9% |
4.8% |
6.0% |
5.5% |
| Food Preparation and Serving Related |
12.4% |
12.9% |
9.8% |
5.4% |
| Building and Grounds Cleaning and Maintenance |
5.6% |
5.1% |
8.9% |
12.2% |
| Personal Care and Service |
3.6% |
3.6% |
4.7% |
2.1% |
| Sales and Related |
10.2% |
10.5% |
9.1% |
5.4% |
| Office and Administrative Support |
14.8% |
14.5% |
13.5% |
21.6% |
| Farming, Fishing, and Forestry |
0.5% |
0.4% |
0.4% |
3.2% |
| Construction and Extraction |
6.7% |
6.5% |
8.8% |
6.8% |
| Installation, Maintenance, and Repair |
6.5% |
6.4% |
9.2% |
5.4% |
| Production |
3.8% |
4.0% |
2.2% |
2.4% |
| Transportation and Material Moving |
6.9% |
7.0% |
5.6% |
6.0% |
LFS 2017 Table P19.2 Occupational Title by Island and District: CNMI 2017 Fourth Qtr. (Distribution Amoung)
| Major Occupational Title |
CNMI
Total |
Saipan |
Tinian |
Rota |
|
|
|
|
Source: Labor Force Survey CNMI, 2017 4th Qrt. |
| Management |
100% |
92.9% |
3.7% |
3.4% |
| Business and Financial Operations |
100% |
95.3% |
2.2% |
2.4% |
| Computer and Mathematical |
100% |
76.1% |
8.3% |
15.6% |
| Architecture and Engineering |
100% |
83.3% |
13.8% |
2.9% |
| Life, Physical, and Social Science |
100% |
57.1% |
26.4% |
16.5% |
| Community and Social Service |
100% |
77.3% |
13.0% |
9.8% |
| Legal |
100% |
100.0% |
0.0% |
0.0% |
| Education, Training, and Library |
100% |
90.7% |
4.3% |
5.0% |
| Arts, Design, Entertainment, Sports, and Media |
100% |
86.0% |
14.0% |
0.0% |
| Healthcare Practitioners and Technical |
100% |
91.8% |
3.0% |
5.2% |
| Healthcare Support |
100% |
92.5% |
3.9% |
3.7% |
| Protective Service |
100% |
88.4% |
6.8% |
4.8% |
| Food Preparation and Serving Related |
100% |
93.7% |
4.4% |
1.8% |
| Building and Grounds Cleaning and Maintenance |
100% |
81.8% |
9.0% |
9.3% |
| Personal Care and Service |
100% |
90.0% |
7.4% |
2.6% |
| Sales and Related |
100% |
92.7% |
5.0% |
2.3% |
| Office and Administrative Support |
100% |
88.6% |
5.1% |
6.3% |
| Farming, Fishing, and Forestry |
100% |
70.6% |
4.0% |
25.3% |
| Construction and Extraction |
100% |
88.3% |
7.4% |
4.3% |
| Installation, Maintenance, and Repair |
100% |
88.5% |
7.9% |
3.6% |
| Production |
100% |
94.1% |
3.2% |
2.7% |
| Transportation and Material Moving |
100% |
91.7% |
4.6% |
3.7% |
Employment Sector
LFS 2017 Table P19.3 Employment Sector by Island and District: CNMI 2017 Fourth Qtr.
| Employment Sector |
CNMI
Total |
Saipan
Total |
Saipan
Dist. 1 |
Saipan
Dist. 2 |
Saipan
Dist. 3 |
Saipan
Dist. 4 |
Saipan
Dist. 5 |
Tinian
Dist. 6 |
Rota
Dist. 7 |
|
|
|
|
|
|
|
|
|
Source: Labor Force Survey CNMI, 2017 4th Qrt. |
| Private sector |
21,248 |
19,570 |
5,357 |
2,856 |
7,353 |
1,352 |
2,652 |
1,036 |
642 |
| Public sector |
4,920 |
4,003 |
1,496 |
400 |
713 |
434 |
959 |
439 |
478 |
LFS 2017 Table P19.3 Employment Sector by Island and District: CNMI 2017 Fourth Qtr. (Distribution Within)
| Employment Sector |
CNMI
Total |
Saipan
Total |
Saipan
Dist. 1 |
Saipan
Dist. 2 |
Saipan
Dist. 3 |
Saipan
Dist. 4 |
Saipan
Dist. 5 |
Tinian
Dist. 6 |
Rota
Dist. 7 |
|
|
|
|
|
|
|
|
|
Source: Labor Force Survey CNMI, 2017 4th Qrt. |
| Private sector |
81.2% |
83.0% |
78.2% |
87.7% |
91.2% |
75.7% |
73.4% |
70.2% |
57.3% |
| Public sector |
18.8% |
17.0% |
21.8% |
12.3% |
8.8% |
24.3% |
26.6% |
29.8% |
42.7% |
LFS 2017 Table P19.3 Employment Sector by Island and District: CNMI 2017 Fourth Qtr. (Distribution Amoung)
| Employment Sector |
CNMI
Total |
Saipan
Total |
Saipan
Dist. 1 |
Saipan
Dist. 2 |
Saipan
Dist. 3 |
Saipan
Dist. 4 |
Saipan
Dist. 5 |
Tinian
Dist. 6 |
Rota
Dist. 7 |
|
|
|
|
|
|
|
|
|
Source: Labor Force Survey CNMI, 2017 4th Qrt. |
| Private sector |
100% |
92.1% |
25.2% |
13.4% |
34.6% |
6.4% |
12.5% |
4.9% |
3.0% |
| Public sector |
100% |
81.4% |
30.4% |
8.1% |
14.5% |
8.8% |
19.5% |
8.9% |
9.7% |