Labor Force Participation Survey 2017 Population Characteristics
CNMI Total
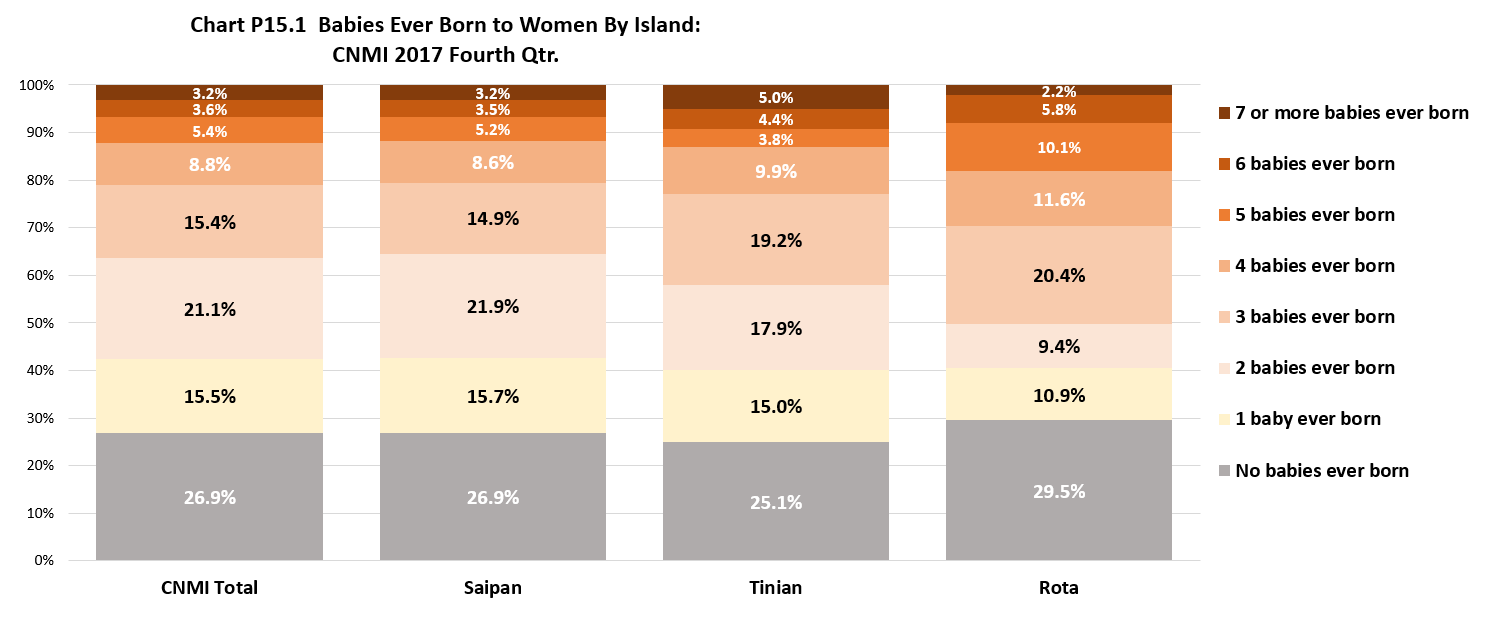
The median number of children born to mothers (female 15 years and over) was 2.0 while the mean was 2.2 in the CNMI in 2017. Mothers with 1 child was 15.5% of all mothers; mothers with 2 children was 21.1%; mothers with 3 children was 15.4%; mothers with 4 children was 8.8%; mothers with 5 children was 5.4 %; mothers with 6 children was 3.6%; and mothers with 7 or more children was 3.2%. Women with no children was 26.9% of all women 15 years and over.
By Island
The median number of children was 3.0 in Rota and 2.0 in both Saipan and Tinian. The mean was 2.4 in Rota, 2.3 in Tinian and 2.1 in Saipan. Mothers in Tinian and Rota had, relatively, more children than mothers in Saipan while mothers in Rota had relatively more children than mothers in Tinian.
By Saipan Districts
The median number of children was 2.0 in all districts while the mean was highest in District 4 (2.5) and lowest in District 3 (1.8). In other words, mothers in District 4 had, relatively, more children than mothers in District 3.
Population Characteristics
LFS 2017 Table P15.1 Number of Babies Born To Women by Island and by District: CNMI 2017 Fourth Qtr.
| Babies Ever Born | CNMI Total |
Saipan Total |
Saipan Dist. 1 |
Saipan Dist. 2 |
Saipan Dist. 3 |
Saipan Dist. 4 |
Saipan Dist. 5 |
Tinian Dist. 6 |
Rota Dist. 7 |
|---|---|---|---|---|---|---|---|---|---|
| Universe: Female 15 yrs and over | Source: Labor Force Survey CNMI, 2017 4th Qrt. | ||||||||
| No babies ever born | 4,925 | 4,462 | 1,287 | 551 | 1,398 | 300 | 925 | 231 | 232 |
| 1 baby ever born | 2,834 | 2,610 | 802 | 387 | 869 | 216 | 336 | 138 | 86 |
| 2 babies ever born | 3,866 | 3,628 | 883 | 410 | 1,580 | 235 | 520 | 164 | 74 |
| 3 babies ever born | 2,813 | 2,476 | 707 | 372 | 752 | 221 | 425 | 176 | 161 |
| 4 babies ever born | 1,616 | 1,433 | 425 | 197 | 383 | 150 | 280 | 91 | 92 |
| 5 babies ever born | 981 | 866 | 315 | 58 | 227 | 155 | 112 | 35 | 80 |
| 6 babies ever born | 661 | 575 | 253 | 98 | 62 | 59 | 104 | 40 | 46 |
| 7 or more babies ever born | 588 | 525 | 233 | 96 | 59 | 43 | 93 | 46 | 17 |
LFS 2017 Table P15.1 Median & Mean of Babies Born To Women by Island and by District: CNMI 2017 Fourth Qtr.
| Babies Ever Born | CNMI Total |
Saipan Total |
Saipan Dist. 1 |
Saipan Dist. 2 |
Saipan Dist. 3 |
Saipan Dist. 4 |
Saipan Dist. 5 |
Tinian Dist. 6 |
Rota Dist. 7 |
|---|---|---|---|---|---|---|---|---|---|
| Universe: Female 15 yrs and over | Source: Labor Force Survey CNMI, 2017 4th Qrt. | ||||||||
| Median | 2 | 2 | 2 | 2 | 2 | 2 | 2 | 2 | 3 |
| Mean | 2.2 | 2.1 | 2.3 | 2.2 | 1.8 | 2.5 | 2.1 | 2.3 | 2.4 |
LFS 2017 Table P15.1 Number of Babies Born To Women by Island and by District: CNMI 2017 Fourth Qtr. (Distribution Within)
| Babies Ever Born | CNMI Total |
Saipan Total |
Saipan Dist. 1 |
Saipan Dist. 2 |
Saipan Dist. 3 |
Saipan Dist. 4 |
Saipan Dist. 5 |
Tinian Dist. 6 |
Rota Dist. 7 |
|---|---|---|---|---|---|---|---|---|---|
| Universe: Female 15 yrs and over | Source: Labor Force Survey CNMI, 2017 4th Qrt. | ||||||||
| No babies ever born | 26.90% | 26.90% | 26.20% | 25.40% | 26.20% | 21.80% | 33.10% | 25.10% | 29.50% |
| 1 baby ever born | 15.50% | 15.70% | 16.30% | 17.90% | 16.30% | 15.70% | 12.00% | 15.00% | 10.90% |
| 2 babies ever born | 21.10% | 21.90% | 18.00% | 18.90% | 29.60% | 17.10% | 18.60% | 17.90% | 9.40% |
| 3 babies ever born | 15.40% | 14.90% | 14.40% | 17.10% | 14.10% | 16.00% | 15.20% | 19.20% | 20.40% |
| 4 babies ever born | 8.80% | 8.60% | 8.70% | 9.10% | 7.20% | 10.80% | 10.00% | 9.90% | 11.60% |
| 5 babies ever born | 5.40% | 5.20% | 6.40% | 2.70% | 4.30% | 11.20% | 4.00% | 3.80% | 10.10% |
| 6 babies ever born | 3.60% | 3.50% | 5.20% | 4.50% | 1.20% | 4.30% | 3.70% | 4.40% | 5.80% |
| 7 or more babies ever born | 3.20% | 3.20% | 4.80% | 4.40% | 1.10% | 3.10% | 3.30% | 5.00% | 2.20% |
LFS 2017 Table P15.1 Number of Babies Born To Women by Island and by District: CNMI 2017 Fourth Qtr. (Distribution Amoung)
| Babies Ever Born | CNMI Total |
Saipan Total |
Saipan Dist. 1 |
Saipan Dist. 2 |
Saipan Dist. 3 |
Saipan Dist. 4 |
Saipan Dist. 5 |
Tinian Dist. 6 |
Rota Dist. 7 |
|---|---|---|---|---|---|---|---|---|---|
| Universe: Female 15 yrs and over | Source: Labor Force Survey CNMI, 2017 4th Qrt. | ||||||||
| No babies ever born | 100% | 90.60% | 26.10% | 11.20% | 28.40% | 6.10% | 18.80% | 4.70% | 4.70% |
| 1 baby ever born | 100% | 92.10% | 28.30% | 13.70% | 30.60% | 7.60% | 11.90% | 4.90% | 3.00% |
| 2 babies ever born | 100% | 93.80% | 22.80% | 10.60% | 40.90% | 6.10% | 13.40% | 4.30% | 1.90% |
| 3 babies ever born | 100% | 88.00% | 25.10% | 13.20% | 26.70% | 7.80% | 15.10% | 6.30% | 5.70% |
| 4 babies ever born | 100% | 88.70% | 26.30% | 12.20% | 23.70% | 9.30% | 17.30% | 5.60% | 5.70% |
| 5 babies ever born | 100% | 88.30% | 32.10% | 5.90% | 23.10% | 15.80% | 11.40% | 3.50% | 8.10% |
| 6 babies ever born | 100% | 87.00% | 38.30% | 14.80% | 9.30% | 8.90% | 15.80% | 6.10% | 6.90% |
| 7 or more babies ever born | 100% | 89.30% | 39.70% | 16.30% | 10.10% | 7.30% | 15.90% | 7.80% | 2.90% |
Population Characteristics
To download, right click on the chart and select “Save Image As”…