CNMI Total
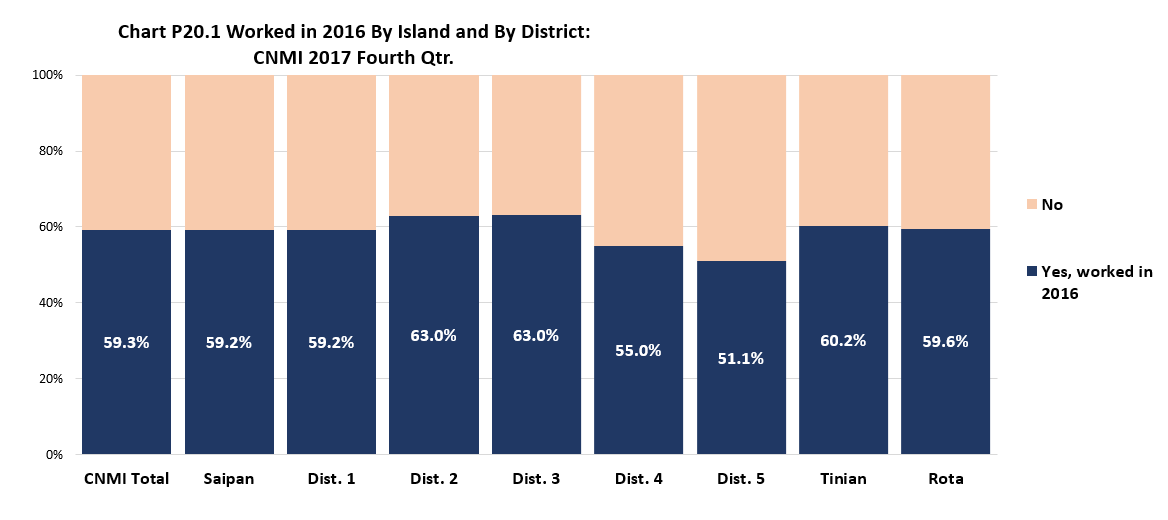
Persons who worked, even for a few days, in 2016 was 53.3% of the total 16 years and over population in the CNMI in 2017.
By Island
The percentage of persons who worked in 2016 was practically the same in all three islands: 60.2% in Tinian, 59.6% in Rota, and 59.2% in Saipan.
By Saipan Districts
The percentage of persons who worked in 2016 was highest in Districts 2 and 3 (both 63.0%) and was lowest in District 5 (51.1%).
CNMI Total
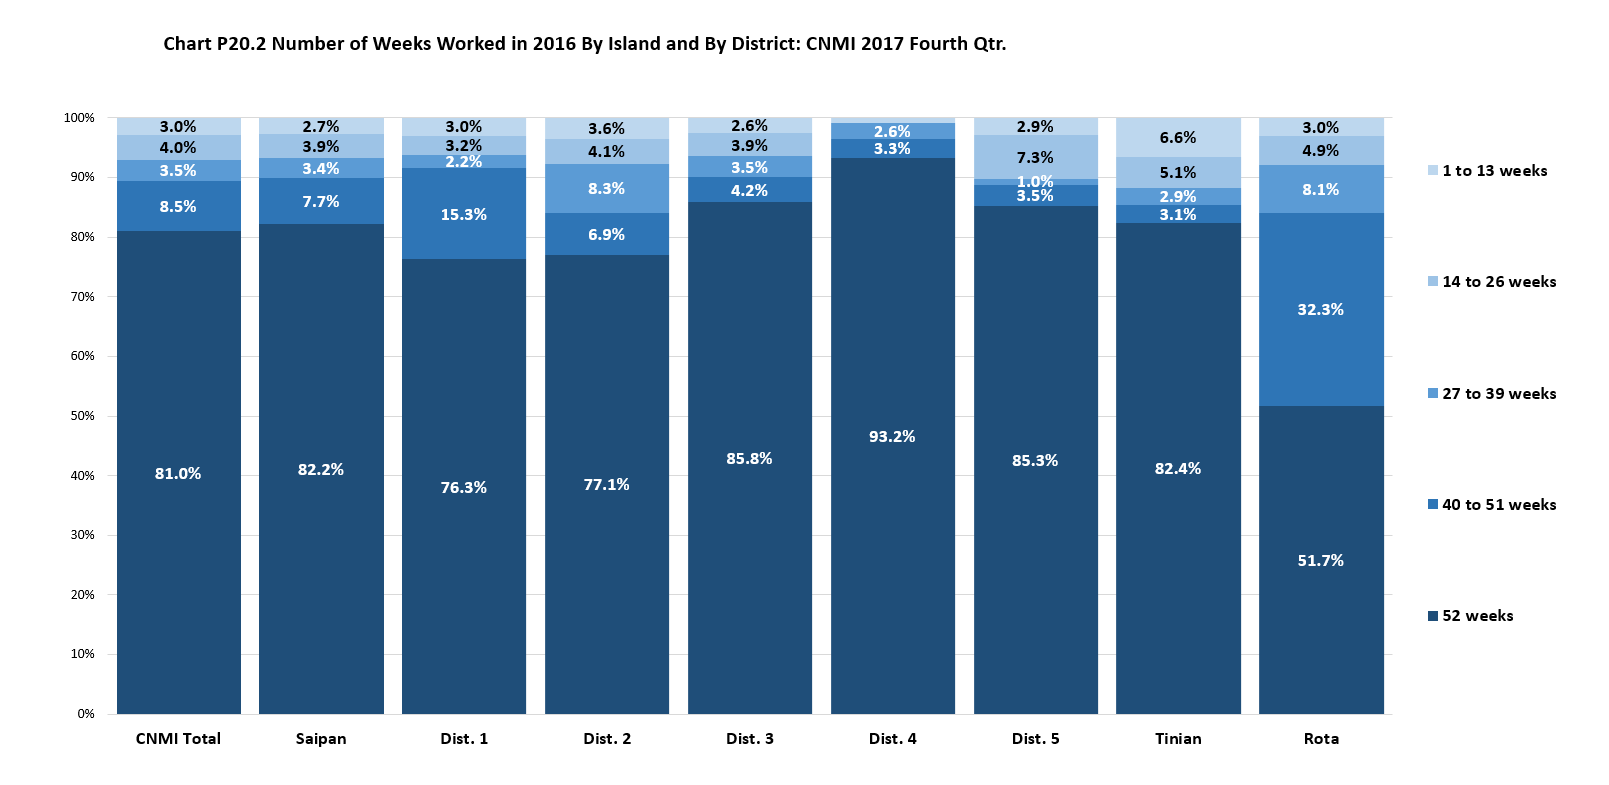
The median number of weeks worked, for all persons who worked in 2016, was 52 while the mean was 48.1. Those who worked for 52 weeks was 81.0% of all persons who worked in 2016; Those who worked 40 to 51 weeks was 8.5%; while those who worked less than 40 weeks was 10.5%.
By Island
The median number of weeks worked was higher in Saipan and in Tinian (both 52.0) than in Rota (48.0) while the mean was slightly higher in Saipan (48.6) than in Tinian (46.9) and in Rota (46.3). The percentage of workers that worked 52 weeks was higher in Saipan (82.2%) and Tinian (82.4%) and lower in Rota (51.7%). The percentage that worked 40 to 51 weeks was higher in Rota (32.3%) than in Saipan (7.7%) and in Tinian (3.1%). The percentage that worked less than 40 weeks was higher in Rota (16.0%) than and in Tinian (14.6%) and in Saipan (10.0%).
By Saipan Districts
The median number of weeks worked was the same in all districts (52.0), while the mean ranged from 46.8 in District 2 to 50.8 in District 4. The percentage of workers that worked 52 weeks was highest in District 4 (93.2%) and was lowest in District 1 (76.3%). The percentage that worked 40 to 51 weeks was highest District 1 (15.3%) and was lowest in District 4 (3.3%). The percentage that worked less than 40 weeks was highest in District 2 (16.0%) and was lowest in District 4 (3.5%).
CNMI Total
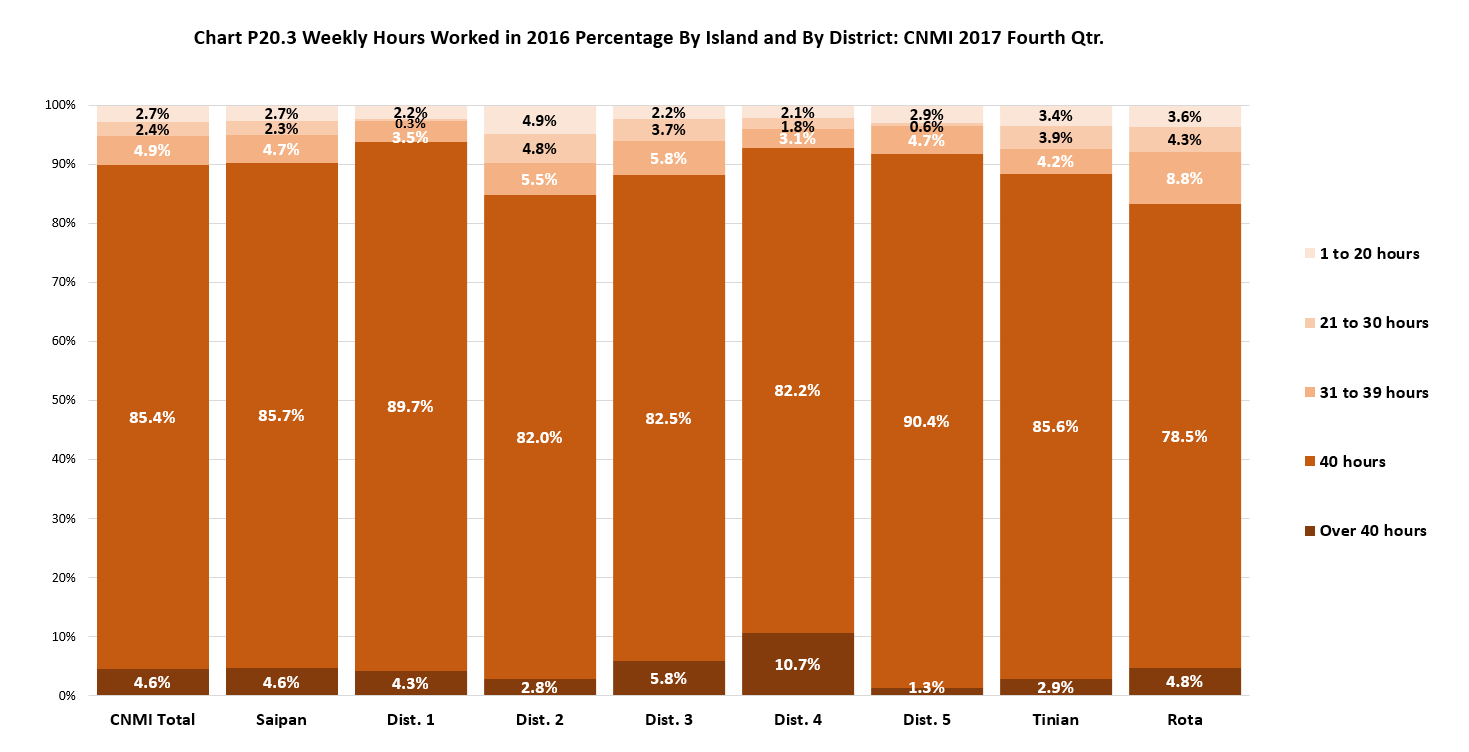
The median number of weekly hours worked, for all persons who worked in 2016, was 40 while the mean was 39.1. Those that worked for 40 hours a week was 85.4% of all persons who worked in 2016; those who worked less than 40 hours a week was 10.1%; while those who worked more than 40 hours a week was 4.6%.
By Island
The median number of weekly hours worked was the same in all three islands (40.0), while the mean was higher in Saipan and in Tinian (both 52.0) than in Rota (48.0), while the mean was practically the same in all three islands: 39.1 in Saipan, 38.8 in Tinian and 38.5 in Rota. The percentage of workers that worked 40 hours a week was higher in Saipan (85.7%) and Tinian (85.6%) and lower in Rota (78.5%). The percentage that worked less than 40 hours a week was higher in Rota (16.7%) than in Tinian (11.5%)and in Saipan (9.7%). The percentage that worked more than 40 hours a week was higher in Rota (4.8%) and in Saipan (4.6%) than and in Tinian (2.9%).
By Saipan Districts
The median number of weekly hours worked was the same in all districts (40.0), while the mean ranged from 38.3 in District 2 to 40.2 in District 4. The percentage of workers that worked 40 hours a week was highest in District 5 (90.4%) and was lowest in District 2 (82.0%). The percentage that worked less than 40 hours a week was highest in District 2 (15.2%) and lowest in District 1 (6.1%). The percentage that worked more than 40 hours a week was highest in District 4 (10.7%) and was lowest in District 5 (1.3%).
Population Characteristics
Worked in 2016
LFS 2017 Table P20.1 Worked in 2016 by Island and by District: CNMI 2017 Fourth Qtr.
| Worked in 2016 |
CNMI
Total |
Saipan
Total |
Saipan
Dist. 1 |
Saipan
Dist. 2 |
Saipan
Dist. 3 |
Saipan
Dist. 4 |
Saipan
Dist. 5 |
Tinian
Dist. 6 |
Rota
Dist. 7 |
| Universe: 16 yrs and over |
|
|
|
|
|
|
|
|
Source: Labor Force Survey CNMI, 2017 4th Qrt. |
| Yes, worked in 2016 |
22,191 |
20,142 |
6,044 |
2,787 |
6,910 |
1,493 |
2,908 |
1,129 |
920 |
| No |
15,228 |
13,859 |
4,165 |
1,639 |
4,051 |
1,221 |
2,783 |
745 |
624 |
LFS 2017 Table P20.1 Worked in 2016 by Island and by District: CNMI 2017 Fourth Qtr. (Distribution Within)
| Worked in 2016 |
CNMI
Total |
Saipan
Total |
Saipan
Dist. 1 |
Saipan
Dist. 2 |
Saipan
Dist. 3 |
Saipan
Dist. 4 |
Saipan
Dist. 5 |
Tinian
Dist. 6 |
Rota
Dist. 7 |
| Universe: 16 yrs and over |
|
|
|
|
|
|
|
|
Source: Labor Force Survey CNMI, 2017 4th Qrt. |
| Yes, worked in 2016 |
59.3% |
59.2% |
59.2% |
63.0% |
63.0% |
55.0% |
51.1% |
60.2% |
59.6% |
| No |
40.7% |
40.8% |
40.8% |
37.0% |
37.0% |
45.0% |
48.9% |
39.8% |
40.4% |
LFS 2017 Table P20.1 Worked in 2016 by Island and by District: CNMI 2017 Fourth Qtr. (Distribution Amoung)
| Worked in 2016 |
CNMI
Total |
Saipan
Total |
Saipan
Dist. 1 |
Saipan
Dist. 2 |
Saipan
Dist. 3 |
Saipan
Dist. 4 |
Saipan
Dist. 5 |
Tinian
Dist. 6 |
Rota
Dist. 7 |
| Universe: 16 yrs and over |
|
|
|
|
|
|
|
|
Source: Labor Force Survey CNMI, 2017 4th Qrt. |
| Yes, worked in 2016 |
100% |
90.8% |
27.2% |
12.6% |
31.1% |
6.7% |
13.1% |
5.1% |
4.1% |
| No |
100% |
91.0% |
27.4% |
10.8% |
26.6% |
8.0% |
18.3% |
4.9% |
4.1% |
Number of Weeks Worked in 2016
LFS 2017 Table P20.2 Number of Weeks Worked in 2016 by Island and by District: CNMI 2017 Fourth Qtr.
| Worked in 2016 |
CNMI
Total |
Saipan
Total |
Saipan
Dist. 1 |
Saipan
Dist. 2 |
Saipan
Dist. 3 |
Saipan
Dist. 4 |
Saipan
Dist. 5 |
Tinian
Dist. 6 |
Rota
Dist. 7 |
|
|
|
|
|
|
|
|
|
Source: Labor Force Survey CNMI, 2017 4th Qrt. |
| 1 to 13 weeks |
655 |
553 |
179 |
99 |
178 |
13 |
84 |
75 |
28 |
| 14 to 26 weeks |
895 |
793 |
196 |
115 |
269 |
– |
213 |
57 |
45 |
| 27 to 39 weeks |
785 |
678 |
135 |
232 |
243 |
40 |
28 |
32 |
75 |
| 40 to 51 weeks |
1,891 |
1,559 |
925 |
192 |
291 |
49 |
103 |
34 |
297 |
| 52 weeks |
17,964 |
16,559 |
4,609 |
2,149 |
5,930 |
1,392 |
2,480 |
930 |
476 |
LFS 2017 Table P20.2 Median & Mean for Weeks Worked in 2016 by Island and by District: CNMI 2017 Fourth Qtr.
| Worked in 2016 |
CNMI
Total |
Saipan
Total |
Saipan
Dist. 1 |
Saipan
Dist. 2 |
Saipan
Dist. 3 |
Saipan
Dist. 4 |
Saipan
Dist. 5 |
Tinian
Dist. 6 |
Rota
Dist. 7 |
|
|
|
|
|
|
|
|
|
Source: Labor Force Survey CNMI, 2017 4th Qrt. |
| Median |
52.0 |
52.0 |
52.0 |
52.0 |
52.0 |
52.0 |
52.0 |
52.0 |
48.0 |
| Mean |
48.1 |
48.6 |
48.5 |
46.8 |
48.7 |
50.8 |
48.2 |
46.9 |
46.3 |
LFS 2017 Table P20.2 Number of Weeks Worked in 2016 by Island and by District: CNMI 2017 Fourth Qtr. (Distribution Within)
| Worked in 2016 |
CNMI
Total |
Saipan
Total |
Saipan
Dist. 1 |
Saipan
Dist. 2 |
Saipan
Dist. 3 |
Saipan
Dist. 4 |
Saipan
Dist. 5 |
Tinian
Dist. 6 |
Rota
Dist. 7 |
|
|
|
|
|
|
|
|
|
Source: Labor Force Survey CNMI, 2017 4th Qrt. |
| 1 to 13 weeks |
3.0% |
2.7% |
3.0% |
3.6% |
2.6% |
0.9% |
2.9% |
6.6% |
3.0% |
| 14 to 26 weeks |
4.0% |
3.9% |
3.2% |
4.1% |
3.9% |
0.0% |
7.3% |
5.1% |
4.9% |
| 27 to 39 weeks |
3.5% |
3.4% |
2.2% |
8.3% |
3.5% |
2.6% |
1.0% |
2.9% |
8.1% |
| 40 to 51 weeks |
8.5% |
7.7% |
15.3% |
6.9% |
4.2% |
3.3% |
3.5% |
3.1% |
32.3% |
| 52 weeks |
81.0% |
82.2% |
76.3% |
77.1% |
85.8% |
93.2% |
85.3% |
82.4% |
51.7% |
LFS 2017 Table P20.2 Number of Weeks Worked in 2016 by Island and by District: CNMI 2017 Fourth Qtr. (Distribution Amoung)
| Worked in 2016 |
CNMI
Total |
Saipan
Total |
Saipan
Dist. 1 |
Saipan
Dist. 2 |
Saipan
Dist. 3 |
Saipan
Dist. 4 |
Saipan
Dist. 5 |
Tinian
Dist. 6 |
Rota
Dist. 7 |
|
|
|
|
|
|
|
|
|
Source: Labor Force Survey CNMI, 2017 4th Qrt. |
| 1 to 13 weeks |
100% |
84.4% |
27.3% |
15.2% |
27.1% |
1.9% |
12.8% |
11.4% |
4.2% |
| 14 to 26 weeks |
100% |
88.6% |
21.9% |
12.9% |
30.0% |
0.0% |
23.8% |
6.4% |
5.0% |
| 27 to 39 weeks |
100% |
86.3% |
17.2% |
29.6% |
30.9% |
5.0% |
3.6% |
4.1% |
9.5% |
| 40 to 51 weeks |
100% |
82.5% |
48.9% |
10.2% |
15.4% |
2.6% |
5.4% |
1.8% |
15.7% |
| 52 weeks |
100% |
92.2% |
25.7% |
12.0% |
33.0% |
7.7% |
13.8% |
5.2% |
2.6% |
Weekly Hours Worked in 2016
LFS 2017 Table P20.3 Weekly Hours Worked in 2016 by Island and by District: CNMI 2017 Fourth Qtr.
| Weekly Hours Worked in 2016 |
CNMI
Total |
Saipan
Total |
Saipan
Dist. 1 |
Saipan
Dist. 2 |
Saipan
Dist. 3 |
Saipan
Dist. 4 |
Saipan
Dist. 5 |
Tinian
Dist. 6 |
Rota
Dist. 7 |
|
|
|
|
|
|
|
|
|
Source: Labor Force Survey CNMI, 2017 4th Qrt. |
| 1 to 20 hours |
610 |
538 |
134 |
136 |
152 |
32 |
84 |
39 |
33 |
| 21 to 30 hours |
542 |
459 |
19 |
134 |
259 |
27 |
19 |
44 |
39 |
| 31 to 39 hours |
1,081 |
953 |
214 |
154 |
400 |
47 |
138 |
48 |
81 |
| 40 hours |
18,946 |
17,258 |
5,419 |
2,285 |
5,697 |
1,228 |
2,630 |
966 |
722 |
| Over 40 hours |
1,011 |
935 |
257 |
79 |
402 |
159 |
38 |
32 |
44 |
LFS 2017 Table P20.3 Median & Mean for Weekly Hours Worked in 2016 by Island and by District: CNMI 2017 Fourth Qtr.
| Weekly Hours Worked in 2016 |
CNMI
Total |
Saipan
Total |
Saipan
Dist. 1 |
Saipan
Dist. 2 |
Saipan
Dist. 3 |
Saipan
Dist. 4 |
Saipan
Dist. 5 |
Tinian
Dist. 6 |
Rota
Dist. 7 |
|
|
|
|
|
|
|
|
|
Source: Labor Force Survey CNMI, 2017 4th Qrt. |
| Median |
40.0 |
40.0 |
40.0 |
40.0 |
40.0 |
40.0 |
40.0 |
40.0 |
40.0 |
| Mean |
39.1 |
39.3 |
39.8 |
38.3 |
39.0 |
40.2 |
39.0 |
38.8 |
38.5 |
LFS 2017 Table P20.3 Weekly Hours Worked in 2016 by Island and by District: CNMI 2017 Fourth Qtr. (Distribution Within)
| Weekly Hours Worked in 2016 |
CNMI
Total |
Saipan
Total |
Saipan
Dist. 1 |
Saipan
Dist. 2 |
Saipan
Dist. 3 |
Saipan
Dist. 4 |
Saipan
Dist. 5 |
Tinian
Dist. 6 |
Rota
Dist. 7 |
|
|
|
|
|
|
|
|
|
Source: Labor Force Survey CNMI, 2017 4th Qrt. |
| 1 to 20 hours |
2.7% |
2.7% |
2.2% |
4.9% |
2.2% |
2.1% |
2.9% |
3.4% |
3.6% |
| 21 to 30 hours |
2.4% |
2.3% |
0.3% |
4.8% |
3.7% |
1.8% |
0.6% |
3.9% |
4.3% |
| 31 to 39 hours |
4.9% |
4.7% |
3.5% |
5.5% |
5.8% |
3.1% |
4.7% |
4.2% |
8.8% |
| 40 hours |
85.4% |
85.7% |
89.7% |
82.0% |
82.5% |
82.2% |
90.4% |
85.6% |
78.5% |
| Over 40 hours |
4.6% |
4.6% |
4.3% |
2.8% |
5.8% |
10.7% |
1.3% |
2.9% |
4.8% |
LFS 2017 Table P20.3 Weekly Hours Worked in 2016 by Island and by District: CNMI 2017 Fourth Qtr. (Distribution Amoung)
| Weekly Hours Worked in 2016 |
CNMI
Total |
Saipan
Total |
Saipan
Dist. 1 |
Saipan
Dist. 2 |
Saipan
Dist. 3 |
Saipan
Dist. 4 |
Saipan
Dist. 5 |
Tinian
Dist. 6 |
Rota
Dist. 7 |
|
|
|
|
|
|
|
|
|
Source: Labor Force Survey CNMI, 2017 4th Qrt. |
| 1 to 20 hours |
100% |
88.2% |
22.0% |
22.3% |
24.8% |
5.2% |
13.8% |
6.3% |
5.5% |
| 21 to 30 hours |
100% |
84.6% |
3.5% |
24.8% |
47.8% |
5.1% |
3.4% |
8.1% |
7.3% |
| 31 to 39 hours |
100% |
88.1% |
19.8% |
14.2% |
37.0% |
4.3% |
12.8% |
4.4% |
7.5% |
| 40 hours |
100% |
91.1% |
28.6% |
12.1% |
30.1% |
6.5% |
13.9% |
5.1% |
3.8% |
| Over 40 hours |
100% |
92.5% |
25.4% |
7.8% |
39.8% |
15.8% |
3.7% |
3.2% |
4.3% |
Population Characteristics
To download, right click on the chart and select “Save Image As”…