CNMI Total
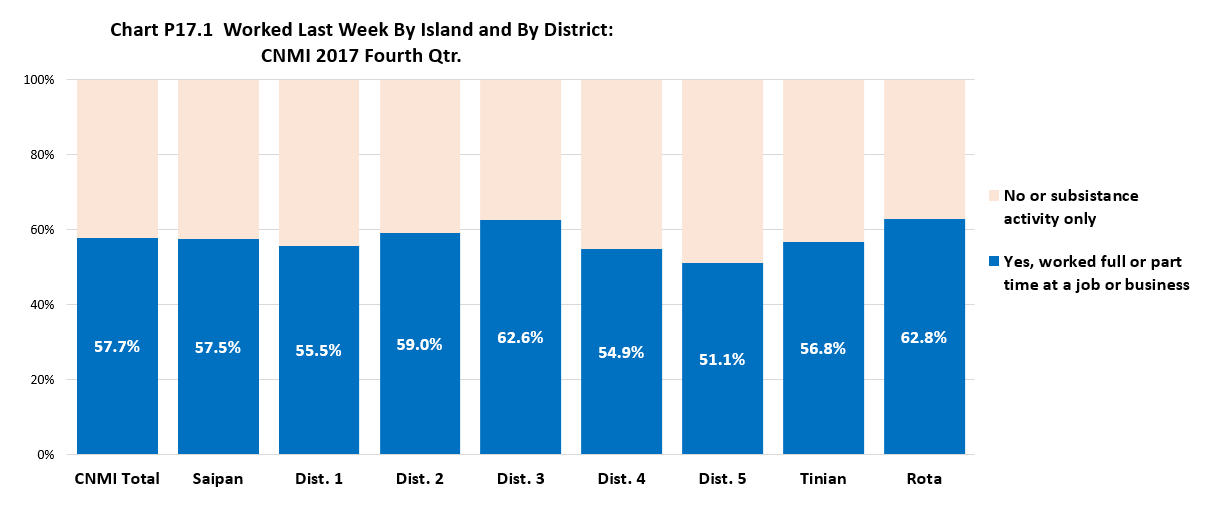
Persons that worked last week (or during the survey period) was 57.7% of the 16 years and over population in the CNMI in 2017.
By Island
The persons that worked last week percentage was higher in Rota (62.8%) than in Saipan (57.5%) and in Tinian (56.8%).
By Saipan Districts
The persons that worked last week percentage was highest in District 3 (62.6%) and was lowest in District 5 (51.1%).
CNMI Total
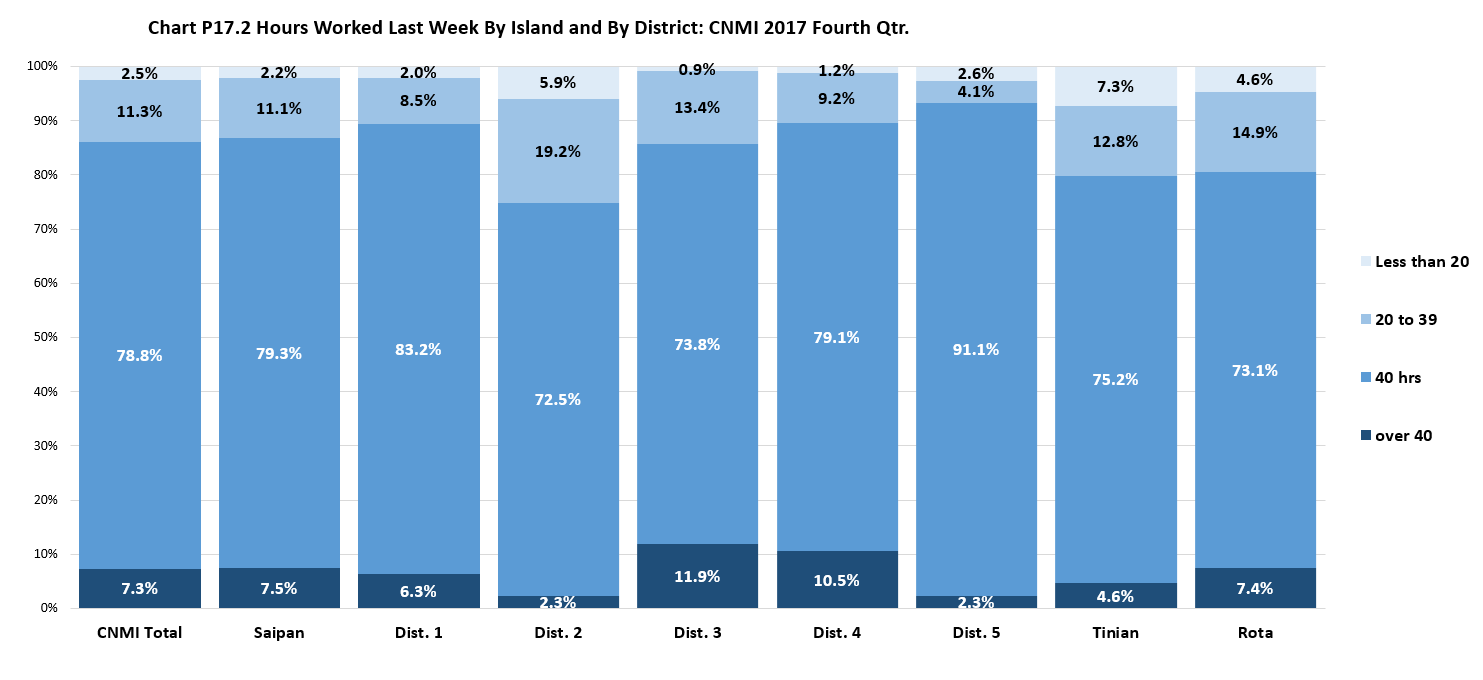
For all persons that worked last week (at the time of the Survey), the median hours worked was 40.0 and the mean was 38.7. Persons that worked 40 hours was 78.8% of all persons that worked; those that worked less than 40 hours was 13.8% while those that worked more than 40 hours was 7.3%.
By Island
The median hours worked was the same for all three islands (40) while the mean was just slightly higher in Saipan ((39.0) than in Rota (38.2) and in Tinian (37.6). The persons that worked 40 hours’ percentage was higher in Saipan (79.3%) than in Tinian (75.2%) and in Rota (73.1%). Those that worked less than 40 hours’ percentage was higher in Tinian (20.1%) than in Rota (19.5%) and in Saipan (13.3%). Those that worked over 40 hours’ percentage was practically the same in Saipan (7.5%) and in Rota (7.4%), but lower in Tinian (4.6%).
By Saipan Districts
The median hours worked was the same in all districts (40.0) while the mean ranged closely from 36.6 in District 3 to 39.3 in Districts 3 and 4. The persons that worked 40 hours’ percentage was highest in District 5 (91.1%) and was lowest in District 2 (72.5%). Those that worked less than 40 hours’ percentage was highest in District 2 (5.9%) and was lowest in District 3 (0.9%). Those that worked over 40 hours’ percentage was highest in District 3 (11.9%) and lowest in Districts 2 and 5 (both 2.3%).
CNMI Total
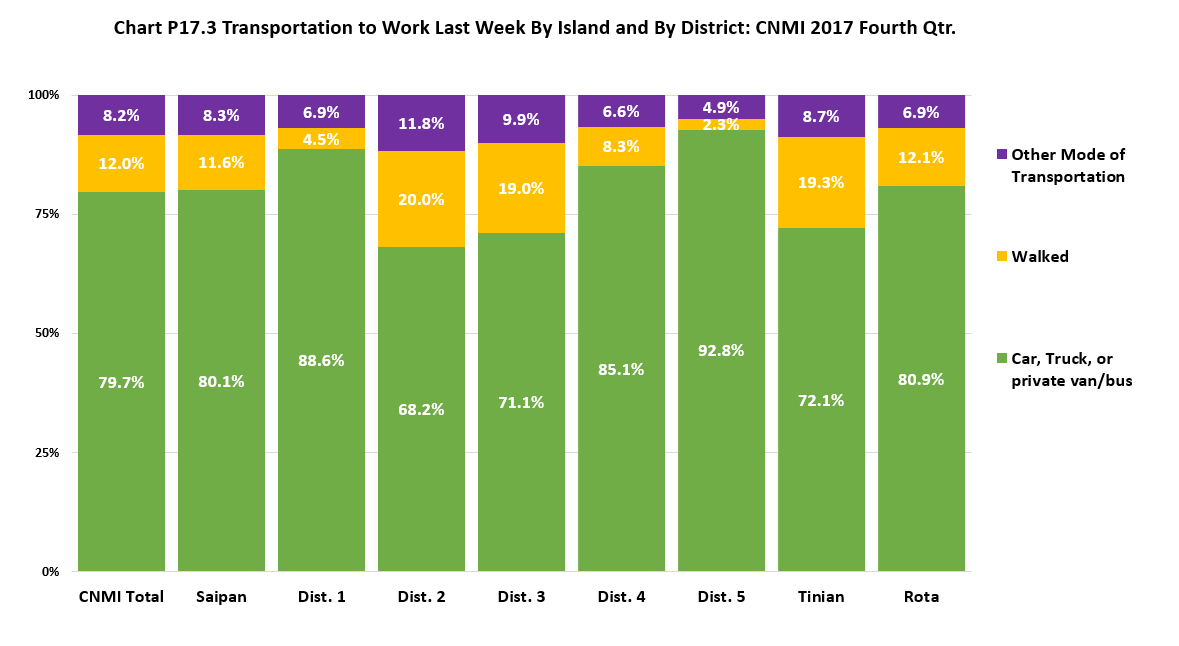
Car, truck, or private van/bus was 79.7% of all modes of transportation to work in the CNMI in 2017. Walked to work was 12.0%; and other modes of transportation was 8.2%.
By Island
The car, truck, or private van/bus percentage was practically the same in Rota (80.9%) and in Saipan (80.1%) and lower in Tinian (72.1%). Walked to work percentage was higher in Tinian (19.3%) than in Rota (12.1%) and in Saipan (11.6%). Other modes of transportation percentage was practically the same in Tinian (8.7%) and in Saipan (8.3%) and was lower in Rota (6.9%).
By Saipan Districts
The car, truck, or private van/bus percentage was highest in District 5 (92.8%) and lowest in District 2 (68.2%). The walked to work percentage was highest in District 2 (20.0%) and lowest in District 5 (2.3%). Other modes of transportation percentage was highest in District 2 (11.8%) and lowest in District 5 (4.9%).
CNMI Total
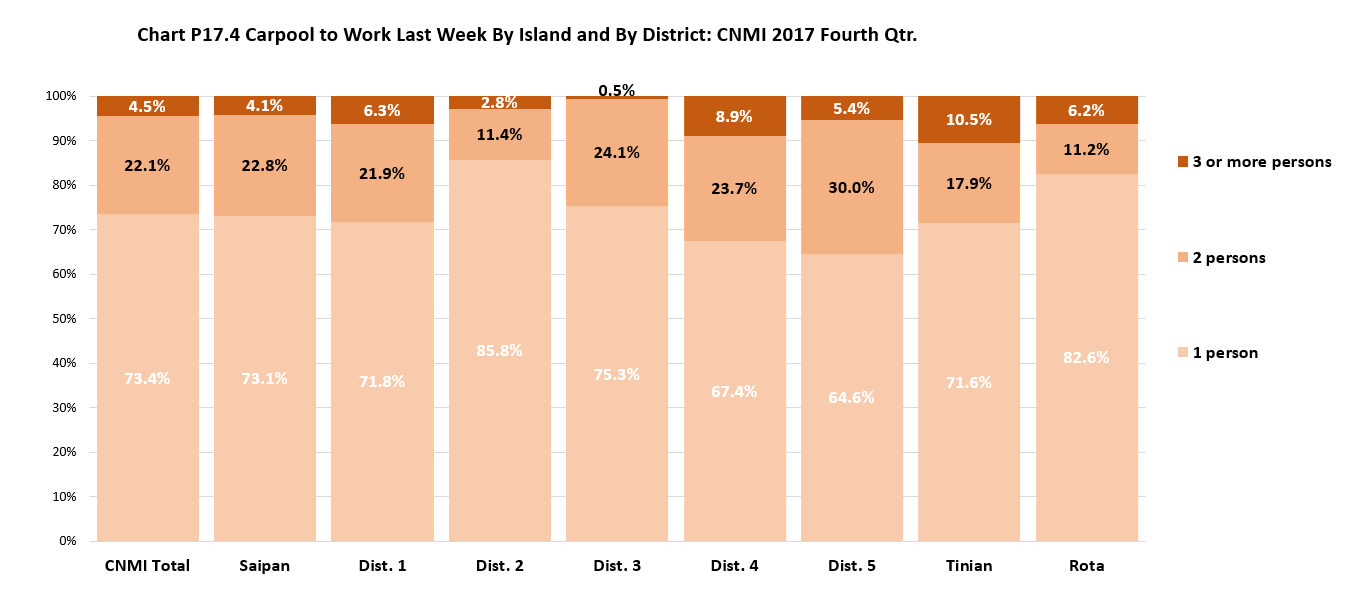
The median number of persons riding together to work was 1.0 and the mean was 1.4 in the CNMI in 2017. One person driving to work was 73.4% of all person who drove to work; two-persons carpooling to work was 22.1% while 3 or more persons carpooling was 4.5%.
By Island
The median number of person driving together to work was the same (1.0) in all three islands while the mean was slightly higher in Tinian (1.5) than in Saipan (1.4) and in Rota (1.2). The one-person driving alone to work percentage was higher in Rota (82.6%) than in Saipan (73.1%) and in Tinian (71.6%). The two-person carpooling percentage was higher in Saipan (22.8%) than in Tinian (17.9%) and in Rota (11.2%). The three or more persons carpooling percentage was higher in Tinian (10.5%) and lower in Saipan (6.2%) and in Saipan (4.5%).
By Saipan Districts
The median number of persons driving together to work was the same in all districts while the mean ranged from 1.2 in District 2 to 1.5 in Districts 1 and 5. The one-person driving to work alone percentage was highest in District 2 (85.8%) and lowest in District 5 (64.6%). The two-person carpooling percentage was highest in District 5 (30.0) and lowest in District 2 (11.4%). The three or more persons carpooling percentage was highest in District 4 (8.9%) and lowest in District 3 (0.5%).
CNMI Total
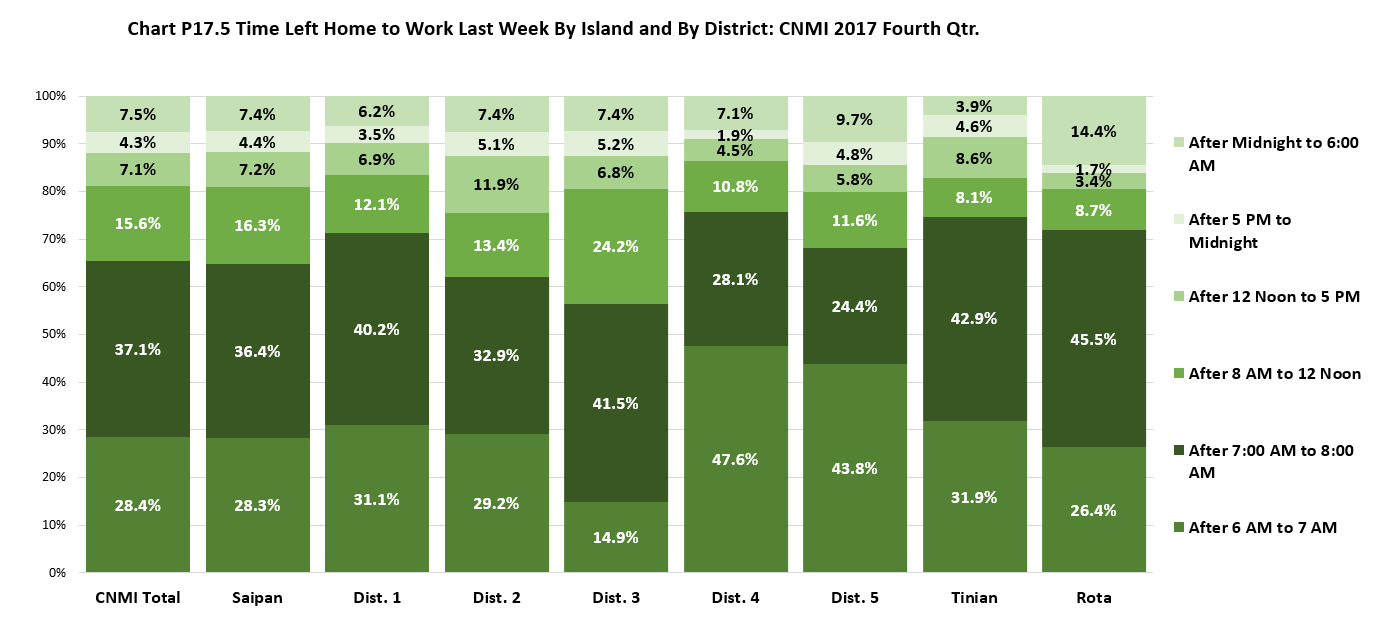
Persons that went to work after 7:00 am to 8:00 am was 37.1% of all persons that worked in the CNMI at the time of the Survey. Those that went to work after 6 am to 7 am was 28.4%; those that went to work after 8:00 am to 12 noon was 15.6%; those that went to work after 12:00 noon to 5:00 pm was 7.1%; those that went to work after 5:00 pm to midnight was 4.3%; while those that left to work after midnight to 6:00 am was 7.5%.
By Island
The percentage of persons that left to work after 7:00 am to 8:00 am was higher in Rota (45.5%) than in Tinian (42.9%) and in Saipan (36.4%). The percentage of those that left to work after 6:00 am to 7:00 am was higher in Tinian (31.9%) than in Saipan (28.3%) and in Rota (26.4%). The percentage that left to work after 8:00 am to 12:00 noon was higher in Saipan (16.3%) than in Rota (8.7%) and in Tinian (8.1%). The percentage that left to work after 12:00 noon to 5:00 pm was higher in Tinian (8.6%) than in Saipan (7.2%) and lower in Rota (3.4%). The percentage that left to work after 5:00 pm to midnight was higher in Tinian (4.6%) and in Saipan (4.4%) and lower in Rota (1.7%). The percentage that left to work after midnight to 6:00 am was higher in Rota (14.4%) than in Saipan (7.4%) and was lower in Tinian (3.9%).
By Saipan Districts
The percentage of persons that left to work after 7:00 am to 8:00 am was highest in District 3 (41.5%) and was lowest in District 5(24.4%). The percentage of those that left to work after 6:00 am to 7:00 am was highest in District 4 (47.6%) and was lowest in District 3 (14.9%). The percentage that left to work after 8:00 am to 12:00 noon was highest in District 3 (24.2%) and was lowest in District 4 (10.8%). The percentage that left to work after 12:00 noon to 5:00 pm was highest in District 2 (11.9%) and was lowest in District 4 (4.5%). The percentage that left to work after 5:00 pm to midnight was highest in District 3 (5.2%) and was lowest in District 4 (1.9%). The percentage that left to work after midnight to 6:00 am was highest in District 5 (9.7%) and was lowest in District 1 (6.2%).
CNMI Total
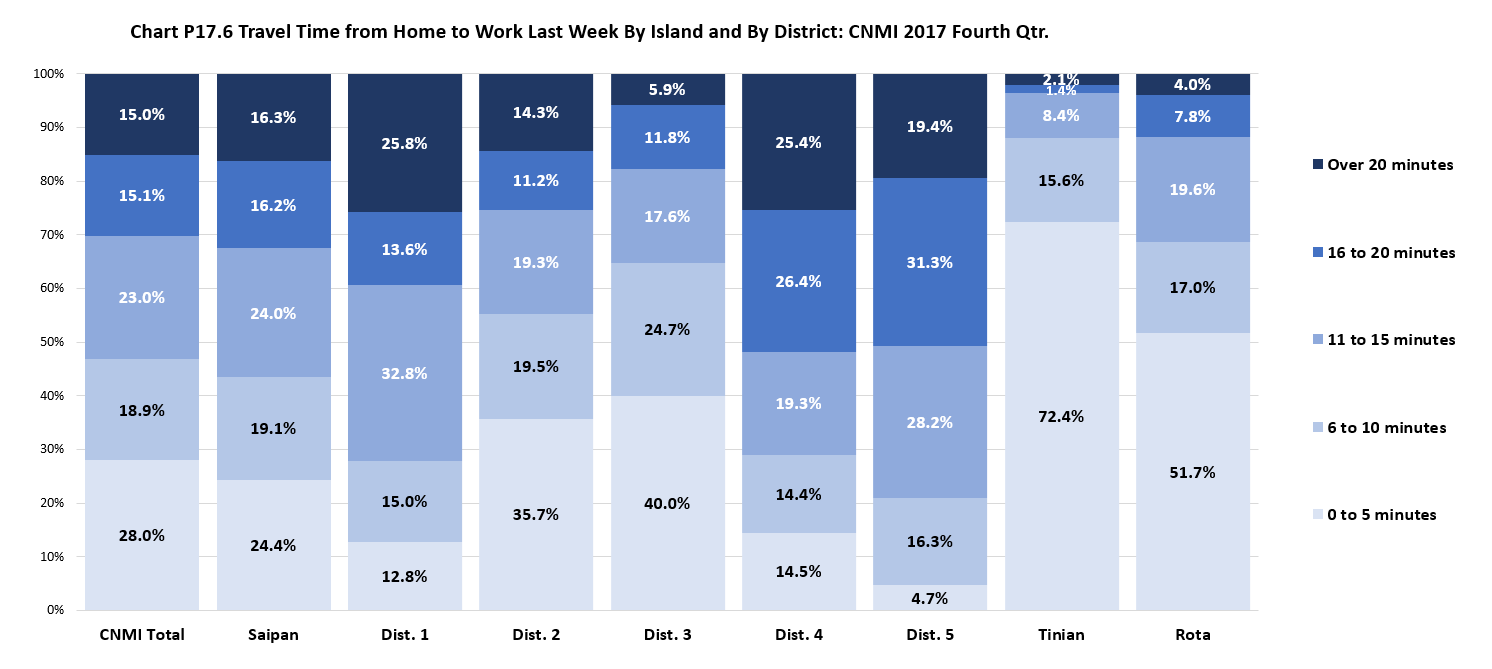
The median travel time to work was 10.0 minutes while the mean was 13.0 minutes in the CNMI at the time of the survey. Persons that traveled up to 5 minutes was 28.0% of all persons that worked at the time of the survey. Those that traveled 6 to 10 minutes to work was 18.9%; those that traveled 11 to 15 minutes was 23.0%; those that traveled 16 to 20 minutes was 15.1%; while those that traveled over 20 minutes was 15.0%.
By Island
The median travel time to work was higher in Saipan (15.0 minutes) and lower in Tinian and Rota (5.0 minutes). The mean travel time to work was also higher in Saipan (14.9 minutes) than in Rota (9.2 minutes) and in Tinian (6.5 minutes). The percentage of workers that traveled 0 to 5 minutes was higher in Tinian (72.4%) than in Rota (51.7%) and was lower in Saipan (24.4%). The percentage of workers that traveled 6 to 10 minutes was higher in Saipan (19.1.%) than in Rota (17.0%) and in Tinian (15.6%). The percentage of workers that traveled 11 to 15 minutes was higher in Saipan (24.0%) than in Rota (19.6%) and in Tinian (8.4%). The percentage of workers that traveled 16 to 20 minutes was higher in Saipan (16.2%) than in Rota (7.8%) and in Tinian (1.4%). The percentage of workers that traveled over 20 minutes was higher in Saipan (16.3%) than in Rota (4.0%) and in Tinian (2.1%).
By Saipan Districts
The median travel time to work ranged from 10.0 minutes in Districts 2 and 3 to 20.0 minutes in Districts 4 and 5, while the man travel time to work ranged from 10.7 minutes in District 3 to 19.0 minutes in District 4. The percentage of workers that traveled 0 to 5 minutes was highest in District 3 (40.0%) and was lowest in District 5 (4.7%). The percentage of workers that traveled 6 to 10 minutes was highest in District 3 (24.7%) and was lower in District 4 (14.4%). The percentage of workers that traveled 11 to 15 minutes was highest in District 1 (32.8%) and was lowest in District 3 (17.6%). The percentage of workers that traveled 16 to 20 minutes was highest in District 5 (31.3%) and was lowest in District 2 (11.2%). The percentage of workers that traveled over 20 minutes was highest in District 1 (25.8%) and was lowest in District 3 (5.9%).
Population Characteristics
Work Last Week
LFS 2017 Table P17.1 Worked Last Week by Island and by District: CNMI 2017 Fourth Qtr.
| Worked Last Week |
CNMI
Total |
Saipan
Total |
Saipan
Dist. 1 |
Saipan
Dist. 2 |
Saipan
Dist. 3 |
Saipan
Dist. 4 |
Saipan
Dist. 5 |
Tinian
Dist. 6 |
Rota
Dist. 7 |
| Universe: 16 yrs and over |
|
|
|
|
|
|
|
|
Source: Labor Force Survey CNMI, 2017 4th Qrt. |
| Yes, worked full or part time at a job or business |
21,574 |
19,541 |
5,670 |
2,613 |
6,860 |
1,491 |
2,908 |
1,064 |
969 |
| No or subsistance activity only |
15,845 |
14,460 |
4,539 |
1,813 |
4,102 |
1,223 |
2,782 |
810 |
575 |
LFS 2017 Table P17.1 Worked Last Week by Island and by District: CNMI 2017 Fourth Qtr. (Distribution Within)
| Worked Last Week |
CNMI
Total |
Saipan
Total |
Saipan
Dist. 1 |
Saipan
Dist. 2 |
Saipan
Dist. 3 |
Saipan
Dist. 4 |
Saipan
Dist. 5 |
Tinian
Dist. 6 |
Rota
Dist. 7 |
| Universe: 16 yrs and over |
|
|
|
|
|
|
|
|
Source: Labor Force Survey CNMI, 2017 4th Qrt. |
| Yes, worked full or part time at a job or business |
57.70% |
57.50% |
55.50% |
59.00% |
62.60% |
54.90% |
51.10% |
56.80% |
62.80% |
| No or subsistance activity only |
42.30% |
42.50% |
44.50% |
41.00% |
37.40% |
45.10% |
48.90% |
43.20% |
37.20% |
LFS 2017 Table P17.1 Worked Last Week by Island and by District: CNMI 2017 Fourth Qtr. (Distribution Amoung)
| Worked Last Week |
CNMI
Total |
Saipan
Total |
Saipan
Dist. 1 |
Saipan
Dist. 2 |
Saipan
Dist. 3 |
Saipan
Dist. 4 |
Saipan
Dist. 5 |
Tinian
Dist. 6 |
Rota
Dist. 7 |
| Universe: 16 yrs and over |
|
|
|
|
|
|
|
|
Source: Labor Force Survey CNMI, 2017 4th Qrt. |
| Yes, worked full or part time at a job or business |
100% |
90.60% |
26.30% |
12.10% |
31.80% |
6.90% |
13.50% |
4.90% |
4.50% |
| No or subsistance activity only |
100% |
91.30% |
28.60% |
11.40% |
25.90% |
7.70% |
17.60% |
5.10% |
3.60% |
Hours Worked Last Week
LFS 2017 Table P17.2 Hours Worked Last Week by Island and by District: CNMI 2017 Fourth Qtr.
| Hours Worked Last Week |
CNMI
Total |
Saipan
Total |
Saipan
Dist. 1 |
Saipan
Dist. 2 |
Saipan
Dist. 3 |
Saipan
Dist. 4 |
Saipan
Dist. 5 |
Tinian
Dist. 6 |
Rota
Dist. 7 |
|
|
|
|
|
|
|
|
|
Source: Labor Force Survey CNMI, 2017 4th Qrt. |
| Less than 20 hrs |
545 |
423 |
115 |
155 |
60 |
18 |
75 |
78 |
45 |
| 20 to less than 40 hrs |
2,445 |
2,164 |
485 |
503 |
920 |
137 |
119 |
136 |
145 |
| 40 hrs |
17,007 |
15,498 |
4,715 |
1,895 |
5,060 |
1,179 |
2,648 |
800 |
708 |
| over 40 hrs |
1,577 |
1,456 |
355 |
59 |
819 |
157 |
66 |
49 |
71 |
LFS 2017 Table P17.2 Median & Mean for Hours Worked Last Week by Island and by District: CNMI 2017 Fourth Qtr.
| Hours Worked Last Week |
CNMI
Total |
Saipan
Total |
Saipan
Dist. 1 |
Saipan
Dist. 2 |
Saipan
Dist. 3 |
Saipan
Dist. 4 |
Saipan
Dist. 5 |
Tinian
Dist. 6 |
Rota
Dist. 7 |
|
|
|
|
|
|
|
|
|
Source: Labor Force Survey CNMI, 2017 4th Qrt. |
| Median |
40 |
40 |
40 |
40 |
40 |
40 |
40 |
40 |
40 |
| Mean |
38.7 |
39 |
39.4 |
36.6 |
39.3 |
39.3 |
39.2 |
37.6 |
38.2 |
LFS 2017 Table P17.2 Hours Worked Last Week by Island and by District: CNMI 2017 Fourth Qtr. (Distribution Within)
| Hours Worked Last Week |
CNMI
Total |
Saipan
Total |
Saipan
Dist. 1 |
Saipan
Dist. 2 |
Saipan
Dist. 3 |
Saipan
Dist. 4 |
Saipan
Dist. 5 |
Tinian
Dist. 6 |
Rota
Dist. 7 |
|
|
|
|
|
|
|
|
|
Source: Labor Force Survey CNMI, 2017 4th Qrt. |
| Less than 20 hrs |
2.50% |
2.20% |
2.00% |
5.90% |
0.90% |
1.20% |
2.60% |
7.30% |
4.60% |
| 20 to less than 40 hrs |
11.30% |
11.10% |
8.50% |
19.20% |
13.40% |
9.20% |
4.10% |
12.80% |
14.90% |
| 40 hrs |
78.80% |
79.30% |
83.20% |
72.50% |
73.80% |
79.10% |
91.10% |
75.20% |
73.10% |
| over 40 hrs |
7.30% |
7.50% |
6.30% |
2.30% |
11.90% |
10.50% |
2.30% |
4.60% |
7.40% |
LFS 2017 Table P17.2 Hours Worked Last Week by Island and by District: CNMI 2017 Fourth Qtr. (Distribution Amoung)
| Hours Worked Last Week |
CNMI
Total |
Saipan
Total |
Saipan
Dist. 1 |
Saipan
Dist. 2 |
Saipan
Dist. 3 |
Saipan
Dist. 4 |
Saipan
Dist. 5 |
Tinian
Dist. 6 |
Rota
Dist. 7 |
|
|
|
|
|
|
|
|
|
Source: Labor Force Survey CNMI, 2017 4th Qrt. |
| Less than 20 hrs |
100% |
77.50% |
21.10% |
28.50% |
10.90% |
3.20% |
13.70% |
14.30% |
8.20% |
| 20 to less than 40 hrs |
100% |
88.50% |
19.80% |
20.60% |
37.60% |
5.60% |
4.90% |
5.60% |
5.90% |
| 40 hrs |
100% |
91.10% |
27.70% |
11.10% |
29.80% |
6.90% |
15.60% |
4.70% |
4.20% |
| over 40 hrs |
100% |
92.30% |
22.50% |
3.80% |
52.00% |
10.00% |
4.20% |
3.10% |
4.50% |
Transportation
LFS 2017 Table P17.3 Transportation to Work by Island and by District: CNMI 2017 Fourth Qtr.
| Transportation to Work |
CNMI
Total |
Saipan
Total |
Saipan
Dist. 1 |
Saipan
Dist. 2 |
Saipan
Dist. 3 |
Saipan
Dist. 4 |
Saipan
Dist. 5 |
Tinian
Dist. 6 |
Rota
Dist. 7 |
|
|
|
|
|
|
|
|
|
Source: Labor Force Survey CNMI, 2017 4th Qrt. |
| Car, Truck, or private van/bus |
17,205 |
15,654 |
5,026 |
1,782 |
4,878 |
1,269 |
2,699 |
766 |
785 |
| Walked |
2,591 |
2,269 |
254 |
524 |
1,301 |
124 |
66 |
205 |
118 |
| Other Mode of Transportation |
1,778 |
1,619 |
390 |
307 |
681 |
98 |
143 |
92 |
67 |
LFS 2017 Table P17.3 Transportation to Work by Island and by District: CNMI 2017 Fourth Qtr. (Distribution Within)
| Transportation to Work |
CNMI
Total |
Saipan
Total |
Saipan
Dist. 1 |
Saipan
Dist. 2 |
Saipan
Dist. 3 |
Saipan
Dist. 4 |
Saipan
Dist. 5 |
Tinian
Dist. 6 |
Rota
Dist. 7 |
|
|
|
|
|
|
|
|
|
Source: Labor Force Survey CNMI, 2017 4th Qrt. |
| Car, Truck, or private van/bus |
79.70% |
80.10% |
88.60% |
68.20% |
71.10% |
85.10% |
92.80% |
72.10% |
80.90% |
| Walked |
12.00% |
11.60% |
4.50% |
20.00% |
19.00% |
8.30% |
2.30% |
19.30% |
12.10% |
| Other Mode of Transportation |
8.20% |
8.30% |
6.90% |
11.80% |
9.90% |
6.60% |
4.90% |
8.70% |
6.90% |
LFS 2017 Table P17.3 Transportation to Work by Island and by District: CNMI 2017 Fourth Qtr. (Distribution Amoung)
| Transportation to Work |
CNMI
Total |
Saipan
Total |
Saipan
Dist. 1 |
Saipan
Dist. 2 |
Saipan
Dist. 3 |
Saipan
Dist. 4 |
Saipan
Dist. 5 |
Tinian
Dist. 6 |
Rota
Dist. 7 |
|
|
|
|
|
|
|
|
|
Source: Labor Force Survey CNMI, 2017 4th Qrt. |
| Car, Truck, or private van/bus |
100% |
91.00% |
29.20% |
10.40% |
28.40% |
7.40% |
15.70% |
4.50% |
4.60% |
| Walked |
100% |
87.60% |
9.80% |
20.20% |
50.20% |
4.80% |
2.50% |
7.90% |
4.50% |
| Other Mode of Transportation |
100% |
91.00% |
21.90% |
17.30% |
38.30% |
5.50% |
8.00% |
5.20% |
3.80% |
Carpool
LFS 2017 Table P17.4 Carpool to Work by Island and by District: CNMI 2017 Fourth Qtr.
| Carpool to Work |
CNMI
Total |
Saipan
Total |
Saipan
Dist. 1 |
Saipan
Dist. 2 |
Saipan
Dist. 3 |
Saipan
Dist. 4 |
Saipan
Dist. 5 |
Tinian
Dist. 6 |
Rota
Dist. 7 |
|
|
|
|
|
|
|
|
|
Source: Labor Force Survey CNMI, 2017 4th Qrt. |
| 1 person |
13,601 |
12,324 |
3,818 |
1,759 |
4,051 |
911 |
1,784 |
606 |
671 |
| 2 persons |
4,085 |
3,843 |
1,163 |
234 |
1,297 |
320 |
829 |
151 |
91 |
| 3 or more persons |
832 |
692 |
335 |
58 |
30 |
120 |
149 |
89 |
51 |
LFS 2017 Table P17.4 Median & Mean for Carpool to Work by Island and by District: CNMI 2017 Fourth Qtr.
| Carpool to Work |
CNMI
Total |
Saipan
Total |
Saipan
Dist. 1 |
Saipan
Dist. 2 |
Saipan
Dist. 3 |
Saipan
Dist. 4 |
Saipan
Dist. 5 |
Tinian
Dist. 6 |
Rota
Dist. 7 |
|
|
|
|
|
|
|
|
|
Source: Labor Force Survey CNMI, 2017 4th Qrt. |
| Median |
1 |
1 |
1 |
1 |
1 |
1 |
1 |
1 |
1 |
| Mean |
1.4 |
1.4 |
1.5 |
1.2 |
1.3 |
1.4 |
1.5 |
1.5 |
1.2 |
LFS 2017 Table P17.4 Carpool to Work by Island and by District: CNMI 2017 Fourth Qtr. (Distribution Within)
| Carpool to Work |
CNMI
Total |
Saipan
Total |
Saipan
Dist. 1 |
Saipan
Dist. 2 |
Saipan
Dist. 3 |
Saipan
Dist. 4 |
Saipan
Dist. 5 |
Tinian
Dist. 6 |
Rota
Dist. 7 |
|
|
|
|
|
|
|
|
|
Source: Labor Force Survey CNMI, 2017 4th Qrt. |
| 1 person |
73.40% |
73.10% |
71.80% |
85.80% |
75.30% |
67.40% |
64.60% |
71.60% |
82.60% |
| 2 persons |
22.10% |
22.80% |
21.90% |
11.40% |
24.10% |
23.70% |
30.00% |
17.90% |
11.20% |
| 3 or more persons |
4.50% |
4.10% |
6.30% |
2.80% |
0.50% |
8.90% |
5.40% |
10.50% |
6.20% |
LFS 2017 Table P17.4 Carpool to Work by Island and by District: CNMI 2017 Fourth Qtr. (Distribution Amoung)
| Carpool to Work |
CNMI
Total |
Saipan
Total |
Saipan
Dist. 1 |
Saipan
Dist. 2 |
Saipan
Dist. 3 |
Saipan
Dist. 4 |
Saipan
Dist. 5 |
Tinian
Dist. 6 |
Rota
Dist. 7 |
|
|
|
|
|
|
|
|
|
Source: Labor Force Survey CNMI, 2017 4th Qrt. |
| 1 person |
100% |
90.60% |
28.10% |
12.90% |
29.80% |
6.70% |
13.10% |
4.50% |
4.90% |
| 2 persons |
100% |
94.10% |
28.50% |
5.70% |
31.70% |
7.80% |
20.30% |
3.70% |
2.20% |
| 3 or more persons |
100% |
83.20% |
40.30% |
6.90% |
3.60% |
14.40% |
18.00% |
10.70% |
6.10% |
Time of Day Left Home to Work
LFS 2017 Table P17.5 Time Left Home to Work by Island and by District: CNMI 2017 Fourth Qtr.
| Time Left to Work |
CNMI
Total |
Saipan
Total |
Saipan
Dist. 1 |
Saipan
Dist. 2 |
Saipan
Dist. 3 |
Saipan
Dist. 4 |
Saipan
Dist. 5 |
Tinian
Dist. 6 |
Rota
Dist. 7 |
|
|
|
|
|
|
|
|
|
Source: Labor Force Survey CNMI, 2017 4th Qrt. |
| After Midnight to 6:00 AM |
1,621 |
1,439 |
353 |
194 |
505 |
106 |
281 |
42 |
140 |
| After 6 AM to 7 AM |
6,128 |
5,533 |
1,762 |
763 |
1,024 |
709 |
1,275 |
339 |
256 |
| After 7:00 AM to 8:00 AM |
8,012 |
7,115 |
2,280 |
860 |
2,845 |
419 |
710 |
456 |
441 |
| After 8 AM to 12 Noon |
3,363 |
3,194 |
686 |
351 |
1,660 |
160 |
337 |
86 |
84 |
| After 12 Noon to 5 PM |
1,528 |
1,404 |
392 |
311 |
467 |
67 |
167 |
91 |
33 |
| After 5 PM to Midnight |
922 |
857 |
197 |
134 |
359 |
29 |
138 |
49 |
16 |
LFS 2017 Table P17.5 Time Left Home to Work by Island and by District: CNMI 2017 Fourth Qtr. (Distribution Within)
| Time Left to Work |
CNMI
Total |
Saipan
Total |
Saipan
Dist. 1 |
Saipan
Dist. 2 |
Saipan
Dist. 3 |
Saipan
Dist. 4 |
Saipan
Dist. 5 |
Tinian
Dist. 6 |
Rota
Dist. 7 |
|
|
|
|
|
|
|
|
|
Source: Labor Force Survey CNMI, 2017 4th Qrt. |
| After Midnight to 6:00 AM |
7.50% |
7.40% |
6.20% |
7.40% |
7.40% |
7.10% |
9.70% |
3.90% |
14.40% |
| After 6 AM to 7 AM |
28.40% |
28.30% |
31.10% |
29.20% |
14.90% |
47.60% |
43.80% |
31.90% |
26.40% |
| After 7:00 AM to 8:00 AM |
37.10% |
36.40% |
40.20% |
32.90% |
41.50% |
28.10% |
24.40% |
42.90% |
45.50% |
| After 8 AM to 12 Noon |
15.60% |
16.30% |
12.10% |
13.40% |
24.20% |
10.80% |
11.60% |
8.10% |
8.70% |
| After 12 Noon to 5 PM |
7.10% |
7.20% |
6.90% |
11.90% |
6.80% |
4.50% |
5.80% |
8.60% |
3.40% |
| After 5 PM to Midnight |
4.30% |
4.40% |
3.50% |
5.10% |
5.20% |
1.90% |
4.80% |
4.60% |
1.70% |
LFS 2017 Table P17.5 Time Left Home to Work by Island and by District: CNMI 2017 Fourth Qtr. (Distribution Amoung)
| Time Left to Work |
CNMI
Total |
Saipan
Total |
Saipan
Dist. 1 |
Saipan
Dist. 2 |
Saipan
Dist. 3 |
Saipan
Dist. 4 |
Saipan
Dist. 5 |
Tinian
Dist. 6 |
Rota
Dist. 7 |
|
|
|
|
|
|
|
|
|
Source: Labor Force Survey CNMI, 2017 4th Qrt. |
| After Midnight to 6:00 AM |
100% |
88.80% |
21.80% |
12.00% |
31.10% |
6.50% |
17.30% |
2.60% |
8.60% |
| After 6 AM to 7 AM |
100% |
90.30% |
28.80% |
12.40% |
16.70% |
11.60% |
20.80% |
5.50% |
4.20% |
| After 7:00 AM to 8:00 AM |
100% |
88.80% |
28.50% |
10.70% |
35.50% |
5.20% |
8.90% |
5.70% |
5.50% |
| After 8 AM to 12 Noon |
100% |
95.00% |
20.40% |
10.40% |
49.40% |
4.80% |
10.00% |
2.50% |
2.50% |
| After 12 Noon to 5 PM |
100% |
91.90% |
25.60% |
20.30% |
30.60% |
4.40% |
10.90% |
6.00% |
2.10% |
| After 5 PM to Midnight |
100% |
92.90% |
21.30% |
14.60% |
38.90% |
3.10% |
15.00% |
5.40% |
1.80% |
Travel Time from Home to Work
LFS 2017 Table P17.6 Travel Time From Home to Work by Island and by District: CNMI 2017 Fourth Qtr.
| Travel Time to Work |
CNMI
Total |
Saipan
Total |
Saipan
Dist. 1 |
Saipan
Dist. 2 |
Saipan
Dist. 3 |
Saipan
Dist. 4 |
Saipan
Dist. 5 |
Tinian
Dist. 6 |
Rota
Dist. 7 |
|
|
|
|
|
|
|
|
|
Source: Labor Force Survey CNMI, 2017 4th Qrt. |
| 0 to 5 minutes |
6,032 |
4,761 |
728 |
934 |
2,746 |
216 |
137 |
770 |
501 |
| 6 to 10 minutes |
4,071 |
3,741 |
848 |
510 |
1,693 |
215 |
475 |
166 |
164 |
| 11 to 15 minutes |
4,961 |
4,682 |
1,860 |
504 |
1,209 |
287 |
821 |
90 |
190 |
| 16 to 20 minutes |
3,264 |
3,174 |
770 |
291 |
809 |
393 |
910 |
15 |
75 |
| Over 20 minutes |
3,245 |
3,184 |
1,463 |
373 |
404 |
379 |
565 |
23 |
39 |
LFS 2017 Table P17.6 Median & Mean for Travel Time From Home to Work by Island and by District: CNMI 2017 Fourth Qtr.
| Travel Time to Work |
CNMI
Total |
Saipan
Total |
Saipan
Dist. 1 |
Saipan
Dist. 2 |
Saipan
Dist. 3 |
Saipan
Dist. 4 |
Saipan
Dist. 5 |
Tinian
Dist. 6 |
Rota
Dist. 7 |
|
|
|
|
|
|
|
|
|
Source: Labor Force Survey CNMI, 2017 4th Qrt. |
| Median |
10 |
15 |
15 |
10 |
10 |
20 |
20 |
5 |
5 |
| Mean |
13 |
14.9 |
17.4 |
12.3 |
10.7 |
19 |
18.1 |
6.5 |
9.2 |
LFS 2017 Table P17.6 Travel Time From Home to Work by Island and by District: CNMI 2017 Fourth Qtr. (Distribution Within)
| Travel Time to Work |
CNMI
Total |
Saipan
Total |
Saipan
Dist. 1 |
Saipan
Dist. 2 |
Saipan
Dist. 3 |
Saipan
Dist. 4 |
Saipan
Dist. 5 |
Tinian
Dist. 6 |
Rota
Dist. 7 |
|
|
|
|
|
|
|
|
|
Source: Labor Force Survey CNMI, 2017 4th Qrt. |
| 0 to 5 minutes |
28.00% |
24.40% |
12.80% |
35.70% |
40.00% |
14.50% |
4.70% |
72.40% |
51.70% |
| 6 to 10 minutes |
18.90% |
19.10% |
15.00% |
19.50% |
24.70% |
14.40% |
16.30% |
15.60% |
17.00% |
| 11 to 15 minutes |
23.00% |
24.00% |
32.80% |
19.30% |
17.60% |
19.30% |
28.20% |
8.40% |
19.60% |
| 16 to 20 minutes |
15.10% |
16.20% |
13.60% |
11.20% |
11.80% |
26.40% |
31.30% |
1.40% |
7.80% |
| Over 20 minutes |
15.00% |
16.30% |
25.80% |
14.30% |
5.90% |
25.40% |
19.40% |
2.10% |
4.00% |
LFS 2017 Table P17.6 Travel Time From Home to Work by Island and by District: CNMI 2017 Fourth Qtr. (Distribution Amoung)
| Travel Time to Work |
CNMI
Total |
Saipan
Total |
Saipan
Dist. 1 |
Saipan
Dist. 2 |
Saipan
Dist. 3 |
Saipan
Dist. 4 |
Saipan
Dist. 5 |
Tinian
Dist. 6 |
Rota
Dist. 7 |
|
|
|
|
|
|
|
|
|
Source: Labor Force Survey CNMI, 2017 4th Qrt. |
| 0 to 5 minutes |
100% |
78.90% |
12.10% |
15.50% |
45.50% |
3.60% |
2.30% |
12.80% |
8.30% |
| 6 to 10 minutes |
100% |
91.90% |
20.80% |
12.50% |
41.60% |
5.30% |
11.70% |
4.10% |
4.00% |
| 11 to 15 minutes |
100% |
94.40% |
37.50% |
10.20% |
24.40% |
5.80% |
16.60% |
1.80% |
3.80% |
| 16 to 20 minutes |
100% |
97.20% |
23.60% |
8.90% |
24.80% |
12.00% |
27.90% |
0.50% |
2.30% |
| Over 20 minutes |
100% |
98.10% |
45.10% |
11.50% |
12.40% |
11.70% |
17.40% |
0.70% |
1.20% |