DescriptionTable DataChart and Figure Data
Ch.1 POPULATION
Ch.1 POPULATION
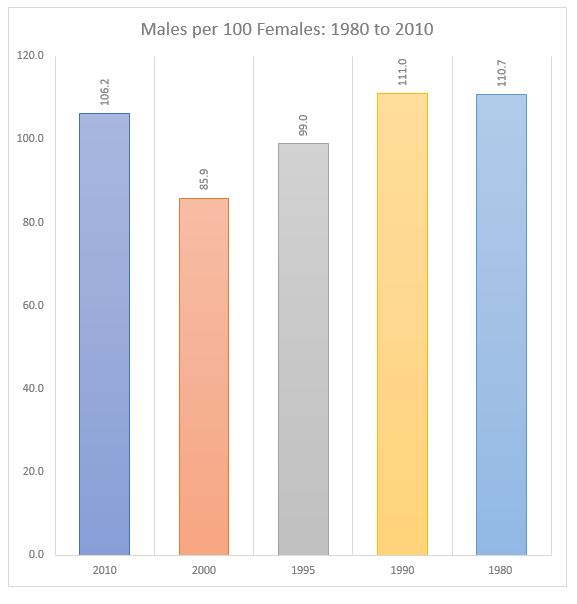
SY 2017 Table 1.12 Males per 100 Females by Age, CNMI: 1980 to 2010
Statistical Yearbook 2017 CNMI CSD
| 2010 | 2000 | 1995 | 1990 | |
|---|---|---|---|---|
| Source: 1995 CNMI Mid-Decade Census Table 6, 1990, 2000 and 2010 CNMI Censuses | ||||
| Less than 5 years | 103.9 | 112.4 | 104.7 | 105.9 |
| 5 to 9 years | 102.0 | 105.8 | 105.6 | 106.1 |
| 10 to 14 years | 114.2 | 106.4 | 99.6 | 108.9 |
| 15 to 19 years | 107.1 | 74.6 | 92.3 | 75.5 |
| 20 to 24 years | 97.7 | 35.4 | 49.3 | 45.3 |
| 25 to 29 years | 76.2 | 46.7 | 64.3 | 100.7 |
| 30 to 34 years | 90.3 | 73.3 | 98.6 | 128.4 |
| 35 to 39 years | 93.1 | 110.6 | 125.3 | 154.6 |
| 40 to 44 years | 103.3 | 132.0 | 147.4 | 188.7 |
| 45 to 49 years | 121.4 | 140.1 | 158.1 | 239.3 |
| 50 to 54 years | 123.7 | 152.9 | 186.8 | 229.7 |
| 55 to 59 years | 121.3 | 156.6 | 170.1 | 153.0 |
| 60 to 64 years | 130.0 | 149.3 | 142.9 | 130.8 |
| 65 to 69 years | 126.4 | 106.3 | 127.2 | 132.3 |
| 70 to 74 years | 142.8 | 98.2 | 90.8 | 80.0 |
| 75 years and over | 84.9 | 68.0 | 51.4 | 49.2 |
To download HD image, right click on image and select “Save Image As”…