DescriptionTable DataChart and Figure Data
Ch.1 POPULATION
Ch.1 POPULATION
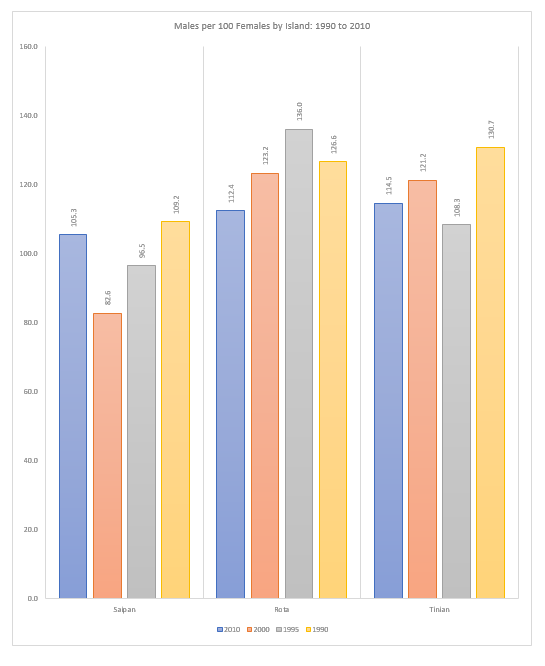
SY 2017 Table 1.13 Males per 100 Females by Island, CNMI: 1990 to 2010 (SPN)
Statistical Yearbook 2017 CNMI CSD
Universe: Total population for Saipan
| 2010 | 2000 | 1995 | 1990 | |
|---|---|---|---|---|
| Source: 1995 CNMI Mid-Decade Census Table 6, 1990, 2000 and 2010 CNMI Censuses Universe: Total population for Saipan |
||||
| Less than 5 years | 103.9 | 112.4 | 104.7 | 105.9 |
| 5 to 9 years | 102.0 | 105.8 | 105.6 | 106.1 |
| 10 to 14 years | 114.2 | 106.4 | 99.6 | 108.9 |
| 15 to 19 years | 107.1 | 74.6 | 92.3 | 75.5 |
| 20 to 24 years | 97.7 | 35.4 | 49.3 | 45.3 |
| 25 to 29 years | 76.2 | 46.7 | 64.3 | 100.7 |
| 30 to 34 years | 90.3 | 73.3 | 98.6 | 128.4 |
| 35 to 39 years | 93.1 | 110.6 | 125.3 | 154.6 |
| 40 to 44 years | 103.3 | 132.0 | 147.4 | 188.7 |
| 45 to 49 years | 121.4 | 140.1 | 158.1 | 239.3 |
| 50 to 54 years | 123.7 | 152.9 | 186.8 | 229.7 |
| 55 to 59 years | 121.3 | 156.6 | 170.1 | 153.0 |
| 60 to 64 years | 130.0 | 149.3 | 142.9 | 130.8 |
| 65 to 69 years | 126.4 | 106.3 | 127.2 | 132.3 |
| 70 to 74 years | 142.8 | 98.2 | 90.8 | 80.0 |
| 75 years and over | 84.9 | 68.0 | 51.4 | 49.2 |
SY 2017 Table 1.13 Males per 100 Females by Island, CNMI: 1990 to 2010 (ROT)
Statistical Yearbook 2017 CNMI CSD
Universe: Total population for Rota
| 2010 | 2000 | 1995 | 1990 | |
|---|---|---|---|---|
| Source: 1995 CNMI Mid-Decade Census Table 6, 1990, 2000 and 2010 CNMI Censuses Universe: Total population for Rota |
||||
| Less than 5 years | 107.1 | 89.7 | 114.8 | 113.1 |
| 5 to 9 years | 108.3 | 119.8 | 109.4 | 99.2 |
| 10 to 14 years | 79.7 | 109.5 | 109.6 | 105.9 |
| 15 to 19 years | 115.7 | 124.5 | 107.1 | 101.4 |
| 20 to 24 years | 115.4 | 102.4 | 99.4 | 102.8 |
| 25 to 29 years | 66.7 | 115.8 | 168.9 | 155.2 |
| 30 to 34 years | 104.4 | 144.9 | 193.6 | 154.0 |
| 35 to 39 years | 105.8 | 176.1 | 161.0 | 131.5 |
| 40 to 44 years | 151.8 | 129.5 | 146.3 | 191.7 |
| 45 to 49 years | 144.4 | 115.7 | 168.0 | 190.6 |
| 50 to 54 years | 125.6 | 166.1 | 170.6 | 188.2 |
| 55 to 59 years | 119.4 | 159.3 | 143.5 | 119.0 |
| 60 to 64 years | 158.1 | 115.0 | 87.5 | 144.4 |
| 65 to 69 years | 127.8 | 70.0 | 117.6 | 177.8 |
| 70 to 74 years | 112.5 | 118.2 | 183.3 | 71.4 |
| 75 years and over | 72.2 | 114.3 | 87.0 | 60.0 |
SY 2017 Table 1.13 Males per 100 Females by Island, CNMI: 1990 to 2010 (TIN)
Statistical Yearbook 2017 CNMI CSD
Universe: Total population for Tinian
| 2010 | 2000 | 1995 | 1990 | |
|---|---|---|---|---|
| Source: 1995 CNMI Mid-Decade Census Table 6, 1990, 2000 and 2010 CNMI Censuses Universe: Total population for Tinian |
||||
| Less than 5 years | 129.2 | 109.8 | 97.4 | 99.2 |
| 5 to 9 years | 112.9 | 94.4 | 80.4 | 114.7 |
| 10 to 14 years | 94.7 | 89.5 | 110.0 | 77.6 |
| 15 to 19 years | 102.7 | 122.3 | 110.8 | 108.2 |
| 20 to 24 years | 92.3 | 94.4 | 92.1 | 88.0 |
| 25 to 29 years | 105.1 | 119.9 | 94.4 | 147.6 |
| 30 to 34 years | 78.0 | 118.2 | 102.7 | 163.3 |
| 35 to 39 years | 139.5 | 152.2 | 138.9 | 219.6 |
| 40 to 44 years | 129.9 | 173.2 | 150.0 | 243.6 |
| 45 to 49 years | 120.9 | 133.7 | 197.8 | 272.7 |
| 50 to 54 years | 143.8 | 227.5 | 112.0 | 140.9 |
| 55 to 59 years | 137.7 | 115.8 | 100.0 | 280.0 |
| 60 to 64 years | 177.8 | 91.7 | 177.8 | 166.7 |
| 65 to 69 years | 71.4 | 130.0 | 75.0 | 46.7 |
| 70 to 74 years | 33.3 | 120.0 | 114.3 | 300.0 |
| 75 years and over | 142.9 | 88.9 | 175.0 | 112.5 |
To download HD image, right click on image and select “Save Image As”…