DescriptionTable DataChart and Figure Data
Ch.1 POPULATION
Ch.1 POPULATION
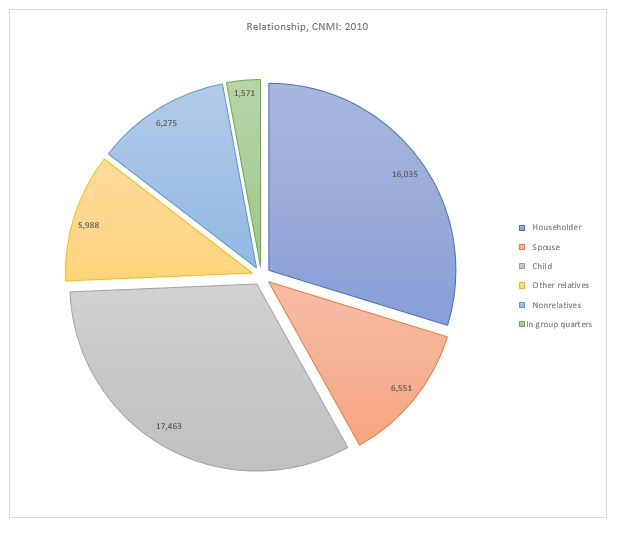
SY 2017 Table 1.15 Relationship by District and Island, CNMI: 2010
Statistical Yearbook 2017 CNMI CSD
Universe: Total population
| Saipan District 1 |
Saipan District 2 |
Saipan District 3 |
Saipan District 4 |
Saipan District 5 |
Rota District 7 |
Tinian District 6 |
|
|---|---|---|---|---|---|---|---|
| Source: U.S. Census Bureau Universe: Total population |
|||||||
| Householder | 4,287 | 2,010 | 5,183 | 1,066 | 1,860 | 755 | 874 |
| Spouse | 1,851 | 690 | 1,906 | 506 | 961 | 318 | 319 |
| Child | 5,181 | 1,940 | 4,545 | 1,275 | 2,773 | 825 | 924 |
| Other relatives | 1,845 | 649 | 1,531 | 550 | 869 | 238 | 306 |
| Nonrelatives | 1,802 | 843 | 1,938 | 359 | 646 | 308 | 379 |
| Institutional population | 0 | 125 | 1 | 0 | 7 | 0 | 0 |
| Noninstitutional population | 194 | 125 | 520 | 91 | 91 | 83 | 334 |
YB 2017 Table 1.15 Households by Type and District and Island, CNMI: 2010
Yearbook 2017 CNMI CSD
Universe: Households
| Saipan District 1 |
Saipan District 2 |
Saipan District 3 |
Saipan District 4 |
Saipan District 5 |
Rota District 7 |
Tinian District 6 |
|
|---|---|---|---|---|---|---|---|
| Source: U.S. Census Bureau Universe: Households |
|||||||
| Married husband-wife families | 1,851 | 690 | 1,906 | 506 | 961 | 318 | 319 |
| Male householder, no wife present | 500 | 232 | 441 | 118 | 217 | 98 | 129 |
| Female householder, no wife present | 713 | 317 | 709 | 153 | 319 | 92 | 125 |
| Nonfamily households | 1,223 | 771 | 2,127 | 289 | 363 | 247 | 301 |
| Male Householder living alone | 524 | 349 | 934 | 139 | 139 | 120 | 155 |
| Female Householder living alone | 242 | 144 | 545 | 64 | 86 | 42 | 48 |
| With individuals under 18 years | 2,327 | 927 | 2,240 | 573 | 1,157 | 377 | 429 |
| With individuals 65 years and over | 358 | 153 | 394 | 131 | 164 | 78 | 54 |
| Average household size | 3.5 | 3.1 | 2.9 | 3.5 | 3.8 | 3.2 | 3.2 |
| Average family size | 3.9 | 3.7 | 3.6 | 4.0 | 4.1 | 3.7 | 3.7 |
To download HD image, right click on image and select “Save Image As”…