DescriptionTable DataChart and Figure Data
Ch.1 POPULATION
Ch.1 POPULATION
SY 2017 Table1.2 Population Density by Island, CNMI: 1920 to 2010 (Population)
Statistical Yearbook 2017 CNMI CSD
Note: 1920 to 1935 for Natives only
| Saipan | Rota | Tinian | N. Island | |
|---|---|---|---|---|
| Source: Census reports for respective years Note: 1920 to 1935 for Natives only |
||||
| 2010 | 48220 | 2527 | 3136 | 0 |
| 2000 | 62392 | 3283 | 3540 | 6 |
| 1995 | 52698 | 3509 | 2631 | 8 |
| 1990 | 38896 | 2295 | 2118 | 36 |
| 1980 | 14549 | 1261 | 866 | 104 |
| 1973 | 12382 | 1104 | 714 | 133 |
| 1967 | 9035 | 1078 | 610 | 263 |
| 1958 | 6654 | 969 | 405 | 262 |
| 1935 | 3194 | 788 | 24 | 291 |
| 1930 | 2915 | 644 | 43 | 227 |
| 1925 | 2639 | 487 | 180 | 187 |
| 1920 | 2449 | 651 | 112 | 186 |
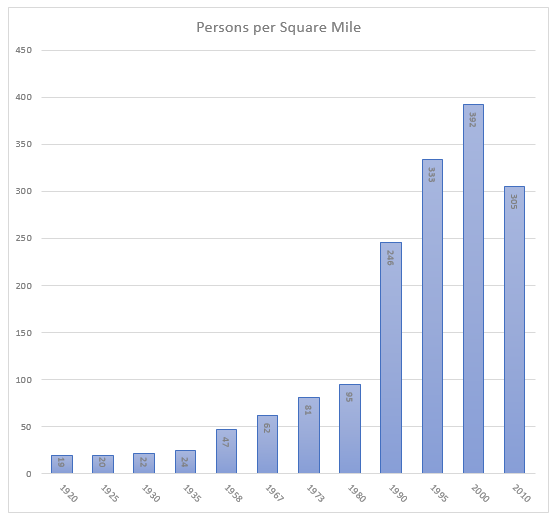
SY 2017 Table1.2 Population Density by Island, CNMI: 1920 to 2010 (Persons Per Square Mile)
Statistical Yearbook 2017 CNMI CSD
Note: 1920 to 1935 for Natives only
Note: Total 176.5 sq mi; Saipan 46.5, Rota 32.8, Tinian 39.2, Northern Islands 55.3
| Saipan | Rota | Tinian | N. Islands | |
|---|---|---|---|---|
| Source: Census reports for respective years Note: 1920 to 1935 for Natives only Note: Total 176.5 sq mi; Saipan 46.5, Rota 32.8, Tinian 39.2, Northern Islands 55.3 |
||||
| 2010 | 1037 | 77 | 80 | 0 |
| 2000 | 1342 | 100 | 90 | 0 |
| 1995 | 1133 | 107 | 67 | 0 |
| 1990 | 836 | 70 | 54 | 1 |
| 1980 | 313 | 38 | 22 | 2 |
| 1973 | 266 | 34 | 18 | 2 |
| 1967 | 194 | 33 | 16 | 5 |
| 1958 | 143 | 30 | 10 | 5 |
| 1935 | 69 | 24 | 1 | 5 |
| 1930 | 63 | 20 | 1 | 4 |
| 1925 | 57 | 15 | 5 | 3 |
| 1920 | 53 | 20 | 3 | 3 |
To download HD image, right click on image and select “Save Image As”…