DescriptionTable DataChart and Figure Data
Ch.1 POPULATION
Ch.1 POPULATION
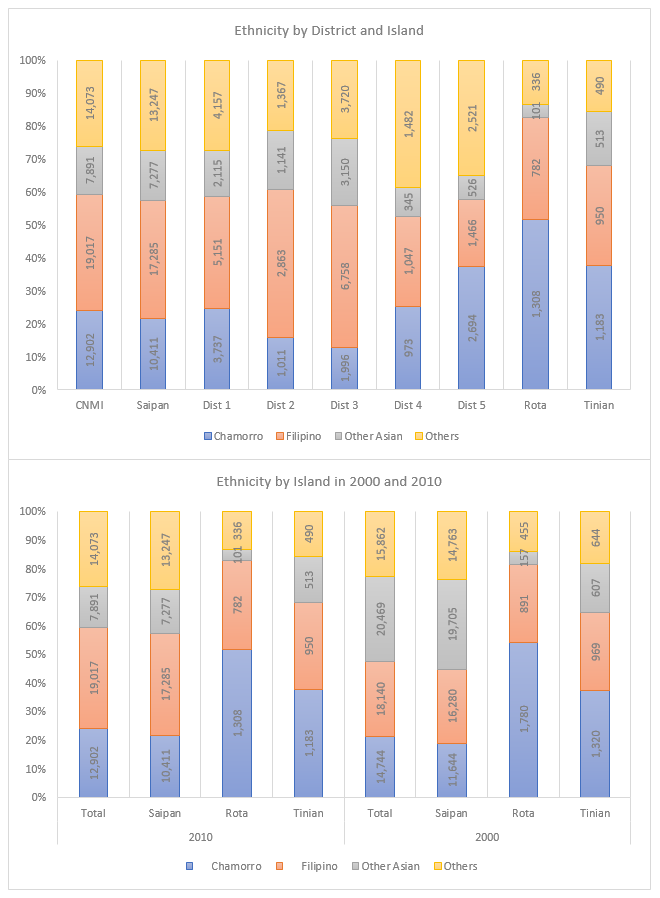
SY 2017 Table 1.31 Ethnicity by District and Island, CNMI: 2010
Statistical Yearbook 2017 CNMI CSD
| Saipan District 1 |
Saipan District 2 |
Saipan District 3 |
Saipan District 4 |
Saipan District 5 |
Rota District 7 |
Tinian District 6 |
|
|---|---|---|---|---|---|---|---|
| Source: U.S. Census Bureau | |||||||
| Carolinian | 674 | 201 | 846 | 224 | 501 | 5 | 10 |
| Chamorro | 3,737 | 1,011 | 1,996 | 973 | 2,694 | 1,308 | 1,183 |
| Chuukese | 467 | 149 | 432 | 64 | 113 | 10 | 7 |
| Kosraean | 14 | 7 | 13 | 2 | 0 | 0 | 1 |
| Marshallese | 28 | 6 | 20 | 5 | 8 | 1 | 0 |
| Palauan | 444 | 136 | 250 | 101 | 197 | 29 | 12 |
| Pohnpeian | 143 | 58 | 68 | 52 | 90 | 12 | 2 |
| Yapese | 112 | 37 | 36 | 20 | 14 | 3 | 6 |
| Other Native Hawaiian and Pacific Islander | 97 | 21 | 57 | 32 | 60 | 0 | 1 |
| Bangladeshi | 105 | 86 | 161 | 19 | 11 | 64 | 55 |
| Chinese | 1,039 | 584 | 1,520 | 78 | 198 | 3 | 237 |
| Filipino | 5,151 | 2,863 | 6,758 | 1,047 | 1,466 | 782 | 950 |
| Japanese | 105 | 39 | 437 | 105 | 52 | 20 | 37 |
| Korean | 688 | 362 | 848 | 86 | 218 | 9 | 425 |
| Nepalese | 42 | 14 | 54 | 15 | 4 | 1 | 97 |
| Thai | 105 | 32 | 69 | 18 | 32 | 1 | 9 |
| Other Asian | 31 | 24 | 61 | 24 | 11 | 3 | 36 |
| Black or African American | 4 | 6 | 19 | 6 | 10 | 4 | 6 |
| Hispanic or African American | 17 | 3 | 14 | 7 | 5 | 2 | 6 |
| White | 212 | 50 | 411 | 177 | 171 | 39 | 57 |
| Other ethnic origin or race | 29 | 38 | 24 | 3 | 15 | 0 | 8 |
| Two or more ethnic origins | 1,916 | 655 | 1,530 | 789 | 1,337 | 231 | 374 |
| Native Hawaiian and other Pacific Islander | 1,765 | 536 | 1,207 | 734 | 1,260 | 221 | 341 |
| Chamorro and other groups | 1,355 | 395 | 830 | 568 | 928 | 208 | 324 |
| Asian and other groups | 874 | 315 | 776 | 242 | 599 | 160 | 269 |
SY 2017 Table 1.32 Ethnicity by District and Island, CNMI: 2000 and 2010
Statistical Yearbook 2017 CNMI CSD
| Saipan 2010 | Rota 2010 | Tinian 2010 | Saipan 2000 | Rota 2000 | Tinian 2000 | |
|---|---|---|---|---|---|---|
| Source: U.S. Census Bureau | ||||||
| Carolinian | 2,446 | 5 | 10 | 2,645 | 4 | 3 |
| Chamorro | 1,0411 | 1,308 | 1,183 | 1,1644 | 1,780 | 1,320 |
| Chuukese | 1,225 | 10 | 7 | 1,382 | 8 | 4 |
| Kosraean | 36 | 0 | 1 | 51 | 5 | 0 |
| Marshallese | 67 | 1 | 0 | 109 | 3 | 0 |
| Palauan | 1,128 | 29 | 12 | 1,642 | 37 | 6 |
| Pohnpeian | 411 | 12 | 2 | 614 | 22 | 4 |
| Yapese | 219 | 3 | 6 | 192 | 0 | 12 |
| Other Native Hawaiian and Pacific Islander | 267 | 0 | 1 | 502 | 22 | 5 |
| Bangladeshi | 382 | 64 | 55 | 690 | 94 | 89 |
| Chinese | 3,419 | 3 | 237 | 15,040 | 16 | 255 |
| Filipino | 17,285 | 782 | 950 | 16,280 | 891 | 969 |
| Japanese | 738 | 20 | 37 | 898 | 36 | 18 |
| Korean | 2,202 | 9 | 425 | 1,945 | 6 | 70 |
| Nepalese | 129 | 1 | 97 | 170 | 1 | 129 |
| Other Asian | 407 | 4 | 45 | 962 | 4 | 46 |
| White | 1,021 | 39 | 57 | 1,121 | 50 | 69 |
| Black or African American | 45 | 4 | 6 | 33 | 4 | 4 |
| Other ethnic origin or race | 155 | 2 | 14 | 435 | 7 | 32 |
| Two or more ethnic origins | 6,227 | 231 | 374 | 6,037 | 313 | 505 |
| Chamorro and other groups | 4,076 | 208 | 324 | 3,727 | 270 | 386 |
| Asian and other groups | 2,806 | 160 | 269 | 2,505 | 175 | 336 |
To download HD image, right click on image and select “Save Image As”…