DescriptionTable DataChart and Figure Data
Ch.1 POPULATION
Ch.1 POPULATION
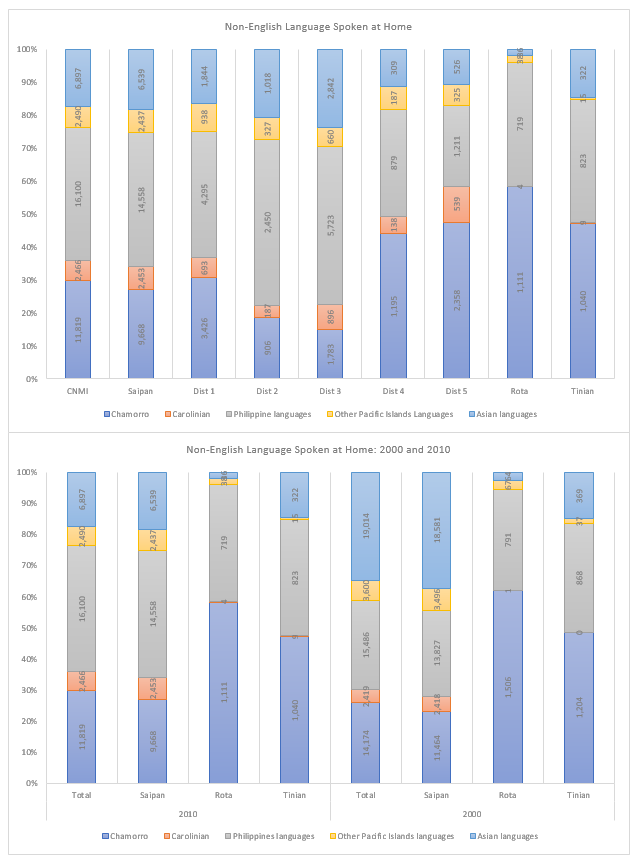
SY 2017 Table 1.36 Language Spoken at Home by District and Island, CNMI: 2010
Statistical Yearbook 2017 CNMI CSD
Universe: Population 5 years and over
| Saipan District 1 |
Saipan District 2 |
Saipan District 3 |
Saipan District 4 |
Saipan District 5 |
Rota District 7 |
Tinian District 6 |
|
|---|---|---|---|---|---|---|---|
| Source: U.S. Census Bureau Universe: Population 5 years and over |
|||||||
| Chamorro | 3,426 | 906 | 1,783 | 1,195 | 2,358 | 1,111 | 1,040 |
| Carolinian | 693 | 187 | 896 | 138 | 539 | 4 | 9 |
| Philippine languages | 4,295 | 2,450 | 5,723 | 879 | 1,211 | 719 | 823 |
| Other Pacific Islands Languages | 938 | 327 | 660 | 187 | 325 | 38 | 15 |
| Chinese | 914 | 515 | 1409 | 69 | 191 | 3 | 215 |
| Korean | 677 | 402 | 859 | 83 | 214 | 8 | 52 |
| Other Asian languages | 253 | 101 | 574 | 157 | 121 | 25 | 55 |
SY 2017 Table 1.37 Language Spoken at Home by Island, CNMI: 2000 and 2010
Statistical Yearbook 2017 CNMI CSD
Universe: Population 5 years and over
| Saipan 2010 | Rota 2010 | Tinian 2010 | Saipan 2000 | Rota 2000 | Tinian 2000 | |
|---|---|---|---|---|---|---|
| Source: U.S. Census Bureau Universe: Population 5 years and over |
||||||
| Chamorro | 9,668 | 1,111 | 1,040 | 11,464 | 1,506 | 1,204 |
| Carolinian | 2,453 | 4 | 9 | 2,418 | 1 | 0 |
| Philippine languages | 14,558 | 719 | 823 | 13,827 | 791 | 868 |
| Other Pacific Islands Languages | 2,437 | 38 | 15 | 3,496 | 67 | 37 |
| Chinese | 3,098 | 3 | 215 | 14,600 | 19 | 243 |
| Korean | 2,235 | 8 | 52 | 2,152 | 4 | 70 |
| Other Asian languages | 1,206 | 25 | 55 | 1,829 | 41 | 56 |
To download HD image, right click on image and select “Save Image As”…