DescriptionTable DataChart and Figure Data
Ch.1 POPULATION
Ch.1 POPULATION
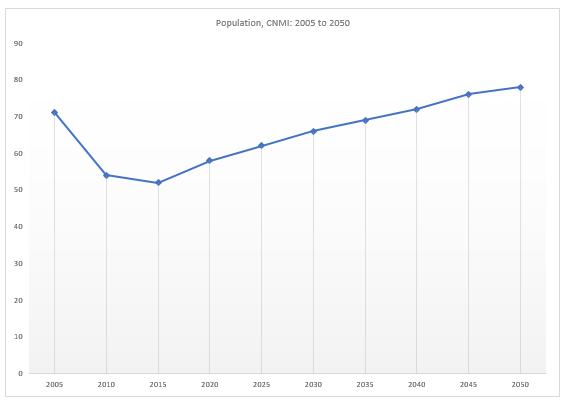
SY 2017 Table 1.46 Estimates and Projections, CNMI: 2005 to 2050
Statistical Yearbook 2017 CNMI CSD
| 2005 | 2010 | 2015 | 2020 | 2025 | 2030 | 2035 | 2040 | 2045 | 2050 | |
|---|---|---|---|---|---|---|---|---|---|---|
| Source: U.S. Census Bureau International Data Base | ||||||||||
| Midyear population (in thousands) | 71 | 54 | 52 | 58 | 62 | 66 | 69 | 72 | 76 | 78 |
| Growth rate (percent) | -26.6 | -3.1 | 2.2 | 1.7 | 1.2 | 1.1 | 1 | 0.9 | 0.7 | 0.4 |
| Total fertility rate (births per woman) | 1.5 | 2.2 | 2 | 1.9 | 1.8 | 1.8 | 1.7 | 1.7 | 1.7 | 1.7 |
| Crude birth rate (per 1,000 population) | 19 | 21 | 18 | 14 | 11 | 10 | 10 | 10 | 9 | 8 |
| Births (in thousands) | 1 | 1 | 1 | 1 | 1 | 1 | 1 | 1 | 1 | 1 |
| Life expectancy at birth (years) | 76 | 77 | 78 | 79 | 79 | 80 | 81 | 81 | 82 | 82 |
| Infant mortality rate (per 1,000 births) | 6 | 6 | 5 | 5 | 5 | 4 | 4 | 4 | 4 | 4 |
| Under 5 mortality rate (per 1,000 births) | 8 | 7 | 7 | 6 | 6 | 5 | 5 | 5 | 4 | 4 |
| Crude death rate (per 1,000 population) | 2 | 3 | 4 | 4 | 5 | 6 | 8 | 9 | 10 | 11 |
| Deaths (in thousands) | 0 | 0 | 0 | 0 | 0 | 0 | 1 | 1 | 1 | 1 |
| Net migration rate (per 1,000 population) | -282 | -49 | 7 | 8 | 7 | 7 | 8 | 8 | 8 | 7 |
| Net number of migrants (in thousands) | -20 | -3 | 0 | 0 | 0 | 0 | 1 | 1 | 1 | 1 |
To download HD image, right click on image and select “Save Image As”…