DescriptionTable DataChart and Figure Data
Ch.1 POPULATION
Ch.1 POPULATION
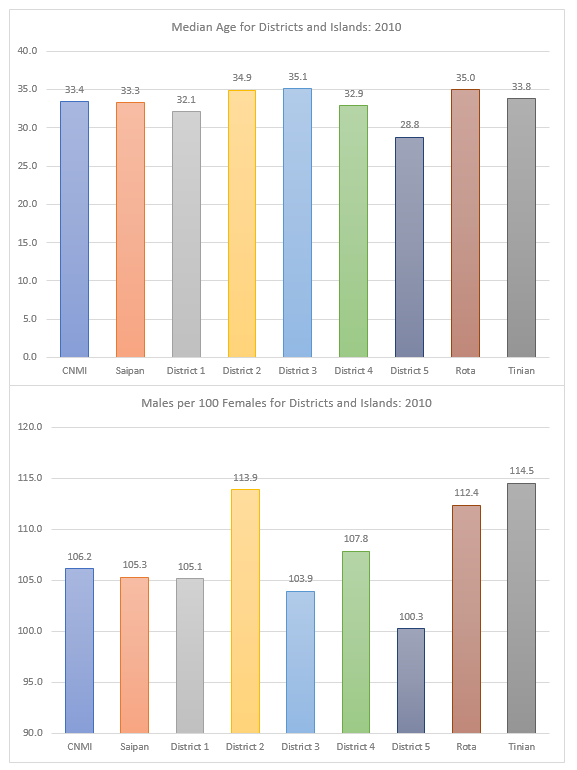
SY 2017 Table 1.8 Population by Age, Island and District 2010
Statistical Yearbook 2017 CNMI CSD
| Saipan District 1 |
Saipan District 2 |
Saipan District 3 |
Saipan District 4 |
Saipan District 5 |
Rota District 7 |
Tinian District 6 |
|
|---|---|---|---|---|---|---|---|
| Source: U.S. Census Bureau | |||||||
| Under 5 years | 1441 | 578 | 1378 | 334 | 618 | 203 | 275 |
| 5 to 9 years | 1404 | 519 | 1240 | 323 | 653 | 227 | 247 |
| 10 to 14 years | 1428 | 533 | 1210 | 379 | 857 | 257 | 257 |
| 15 to 19 years | 1207 | 450 | 1044 | 311 | 823 | 192 | 223 |
| 20 to 24 years | 814 | 305 | 727 | 195 | 395 | 84 | 150 |
| 25 to 29 years | 832 | 353 | 947 | 234 | 345 | 115 | 201 |
| 30 to 34 years | 1076 | 462 | 1250 | 245 | 396 | 186 | 283 |
| 35 to 39 years | 1317 | 630 | 1642 | 277 | 592 | 247 | 352 |
| 40 to 44 years | 1472 | 755 | 1745 | 410 | 723 | 277 | 384 |
| 45 to 49 years | 1397 | 614 | 1486 | 365 | 620 | 220 | 307 |
| 50 to 54 years | 1164 | 529 | 1231 | 297 | 504 | 203 | 195 |
| 55 to 59 years | 729 | 324 | 790 | 214 | 282 | 147 | 126 |
| 60 to 64 years | 455 | 158 | 449 | 116 | 211 | 80 | 75 |
| 65 to 69 years | 191 | 76 | 216 | 60 | 91 | 41 | 24 |
| 70 to 74 years | 112 | 45 | 152 | 44 | 50 | 17 | 20 |
| 75 to 79 years | 71 | 27 | 71 | 28 | 28 | 17 | 8 |
| 80 to 84 years | 32 | 14 | 35 | 13 | 13 | 9 | 4 |
| 85 years and over | 18 | 10 | 11 | 2 | 6 | 5 | 5 |
| Median | 32.1 | 34.9 | 35.1 | 32.9 | 28.8 | 35 | 33.8 |
SY 2017 Table 1.9 Population by Age, Island and District 2010 (Male)
Statistical Yearbook 2017 CNMI CSD
Note: Population for Male only
| Age (Male) | Saipan District 1 |
Saipan District 2 |
Saipan District 3 |
Saipan District 4 |
Saipan District 5 |
Rota District 7 |
Tinian District 6 |
|---|---|---|---|---|---|---|---|
| Source: U.S. Census Bureau Note: Population for Male only |
|||||||
| Under 5 years | 717 | 290 | 729 | 163 | 317 | 105 | 155 |
| 5 to 9 years | 697 | 259 | 658 | 161 | 315 | 118 | 131 |
| 10 to 14 years | 790 | 296 | 600 | 211 | 453 | 114 | 125 |
| 15 to 19 years | 621 | 236 | 531 | 162 | 433 | 103 | 113 |
| 20 to 24 years | 414 | 163 | 332 | 100 | 195 | 45 | 72 |
| 25 to 29 years | 362 | 164 | 389 | 106 | 151 | 46 | 103 |
| 30 to 34 years | 506 | 230 | 575 | 129 | 187 | 95 | 124 |
| 35 to 39 years | 629 | 348 | 785 | 131 | 256 | 127 | 205 |
| 40 to 44 years | 747 | 414 | 861 | 221 | 351 | 167 | 217 |
| 45 to 49 years | 785 | 329 | 826 | 193 | 325 | 130 | 168 |
| 50 to 54 years | 623 | 312 | 713 | 156 | 256 | 113 | 115 |
| 55 to 59 years | 397 | 175 | 443 | 119 | 148 | 80 | 73 |
| 60 to 64 years | 249 | 92 | 263 | 59 | 122 | 49 | 48 |
| 65 to 69 years | 112 | 45 | 115 | 40 | 42 | 23 | 10 |
| 70 to 74 years | 65 | 25 | 90 | 23 | 34 | 9 | 5 |
| 75 to 79 years | 28 | 12 | 33 | 15 | 13 | 8 | 5 |
| 80 to 84 years | 18 | 6 | 16 | 6 | 8 | 4 | 2 |
| 85 years and over | 10 | 2 | 4 | 1 | 2 | 1 | 3 |
| Median | 32.9 | 36.1 | 36.4 | 33.5 | 28.3 | 37.2 | 35.4 |
SY 2017 Table 1.10 Population by Age, Island and District 2010 (Female)
Statistical Yearbook 2017 CNMI CSD
Note: Population for Female only
| Age (Female) | Saipan District 1 |
Saipan District 2 |
Saipan District 3 |
Saipan District 4 |
Saipan District 5 |
Rota District 7 |
Tinian District 6 |
|---|---|---|---|---|---|---|---|
| Source: U.S. Census Bureau Note: Population for Female only |
|||||||
| Under 5 years | 724 | 288 | 649 | 171 | 301 | 98 | 120 |
| 5 to 9 years | 707 | 260 | 582 | 162 | 338 | 109 | 116 |
| 10 to 14 years | 638 | 237 | 610 | 168 | 404 | 143 | 132 |
| 15 to 19 years | 586 | 214 | 513 | 149 | 390 | 89 | 110 |
| 20 to 24 years | 400 | 142 | 395 | 95 | 200 | 39 | 78 |
| 25 to 29 years | 470 | 189 | 558 | 128 | 194 | 69 | 98 |
| 30 to 34 years | 570 | 232 | 675 | 116 | 209 | 91 | 159 |
| 35 to 39 years | 688 | 282 | 857 | 146 | 336 | 120 | 147 |
| 40 to 44 years | 725 | 341 | 884 | 189 | 372 | 110 | 167 |
| 45 to 49 years | 612 | 285 | 660 | 172 | 295 | 90 | 139 |
| 50 to 54 years | 541 | 217 | 518 | 141 | 248 | 90 | 80 |
| 55 to 59 years | 332 | 149 | 347 | 95 | 134 | 67 | 53 |
| 60 to 64 years | 206 | 66 | 186 | 57 | 89 | 31 | 27 |
| 65 to 69 years | 79 | 31 | 101 | 20 | 49 | 18 | 14 |
| 70 to 74 years | 47 | 20 | 62 | 21 | 16 | 8 | 15 |
| 75 to 79 years | 43 | 15 | 38 | 13 | 15 | 9 | 3 |
| 80 to 84 years | 14 | 8 | 19 | 7 | 5 | 5 | 2 |
| 85 years and over | 8 | 8 | 7 | 1 | 4 | 4 | 2 |
| Median | 31.5 | 33.5 | 33.9 | 32 | 29.3 | 32.6 | 32.3 |
SY 2017 Table 1.11 Males per 100 Females by Age, Island and District: 2010
Statistical Yearbook 2017 CNMI CSD
| Saipan District 1 |
Saipan District 2 |
Saipan District 3 |
Saipan District 4 |
Saipan District 5 |
Rota District 7 |
Tinian District 6 |
|
|---|---|---|---|---|---|---|---|
| Source: U.S. Census Bureau | |||||||
| Under 5 years | 99.0 | 100.7 | 112.3 | 95.3 | 105.3 | 107.1 | 129.2 |
| 5 to 9 years | 98.6 | 99.6 | 113.1 | 99.4 | 93.2 | 108.3 | 112.9 |
| 10 to 14 years | 123.8 | 124.9 | 98.4 | 125.6 | 112.1 | 79.7 | 94.7 |
| 15 to 19 years | 106.0 | 110.3 | 103.5 | 108.7 | 111.0 | 115.7 | 102.7 |
| 20 to 24 years | 103.5 | 114.8 | 84.1 | 105.3 | 97.5 | 115.4 | 92.3 |
| 25 to 29 years | 77.0 | 86.8 | 69.7 | 82.8 | 77.8 | 66.7 | 105.1 |
| 30 to 34 years | 88.8 | 99.1 | 85.2 | 111.2 | 89.5 | 104.4 | 78.0 |
| 35 to 39 years | 91.4 | 123.4 | 91.6 | 89.7 | 76.2 | 105.8 | 139.5 |
| 40 to 44 years | 103.0 | 121.4 | 97.4 | 116.9 | 94.4 | 151.8 | 129.9 |
| 45 to 49 years | 128.3 | 115.4 | 125.2 | 112.2 | 110.2 | 144.4 | 120.9 |
| 50 to 54 years | 115.2 | 143.8 | 137.6 | 110.6 | 103.2 | 125.6 | 143.8 |
| 55 to 59 years | 119.6 | 117.4 | 127.7 | 125.3 | 110.4 | 119.4 | 137.7 |
| 60 to 64 years | 120.9 | 139.4 | 141.4 | 103.5 | 137.1 | 158.1 | 177.8 |
| 65 to 69 years | 141.8 | 145.2 | 113.9 | 200.0 | 85.7 | 127.8 | 71.4 |
| 70 to 74 years | 138.3 | 125.0 | 145.2 | 109.5 | 212.5 | 112.5 | 33.3 |
| 75 to 79 years | 65.1 | 80.0 | 86.8 | 115.4 | 86.7 | 88.9 | 166.7 |
| 80 to 84 years | 128.6 | 75.0 | 84.2 | 85.7 | 160.0 | 80.0 | 100.0 |
| 85 years and over | 125.0 | 25.0 | 57.1 | 100.0 | 50.0 | 25.0 | 150.0 |
To download HD image, right click on image and select “Save Image As”…