Ch.11 TRADE
Ch.11 TRADE
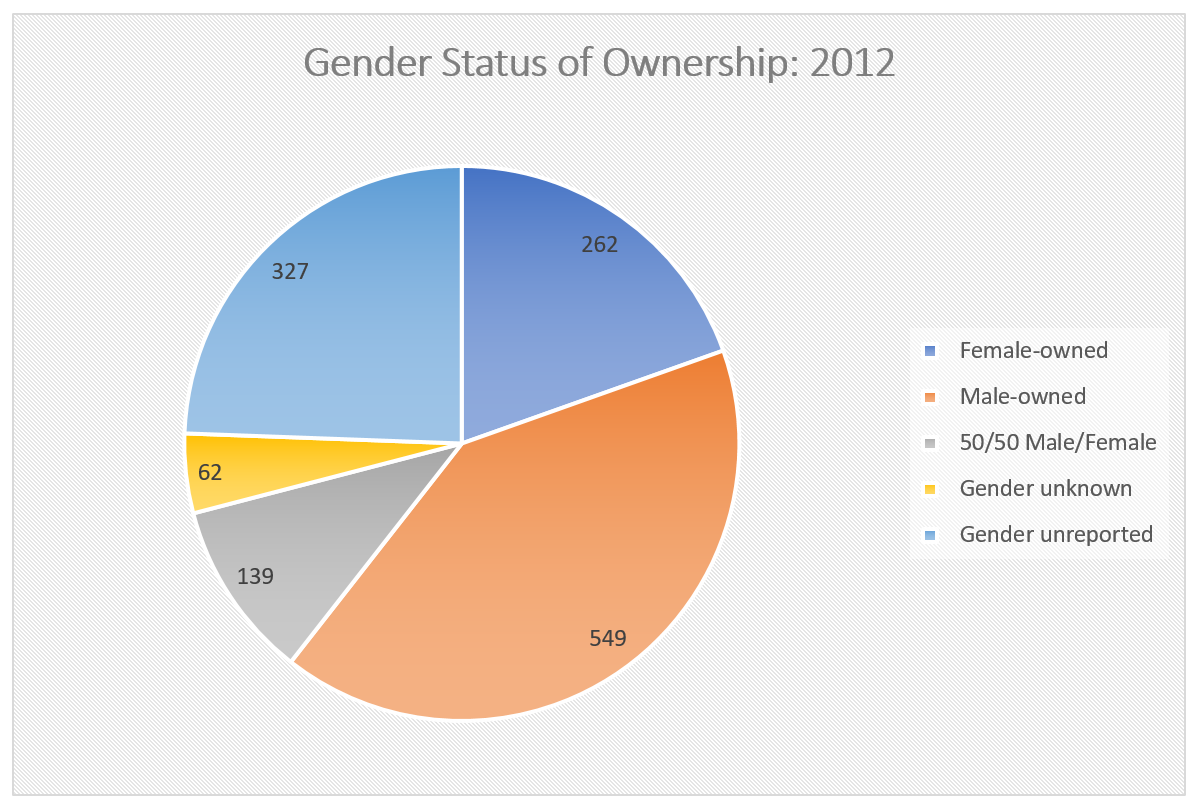
SY 2017 Table 11.7 Gender Status of Ownership, CNMI: 2012 (TOTAL)
Statistical Yearbook 2017 CNMI CSD
“N”: Not available or not comparable
“X”: Not applicable (for the Commodity Flow Survey, not applicable or comparison data unavailable)
“S”: Withheld because estimate did not meet publication standards.
“D”: Withheld to avoid disclosing data for individual companies; data are included in higher level totals
| Meaning of 2012 NAICS code | Number of establishments | Value of sales, receipts, revenue, shipments, or business done ($1,000) | Annual payroll ($1,000) | First-quarter payroll ($1,000) | Paid employees for pay period including March 12 (number) | |
|---|---|---|---|---|---|---|
| Source: U.S. Census Bureau, 2012 Economic Census of Island Areas | ||||||
| Female-owned | 262 | 143,099 | 20,386 | 4,745 | 1,967 | |
| Male-owned | 549 | 361,676 | 66,186 | 16,259 | 5,349 | |
| 50/50 Male/Female | 139 | 81,640 | 17,514 | 4,442 | 1,318 | |
| Gender unknown | 62 | 457,545 | 47,321 | 12,293 | 2,455 | |
| Gender unreported | 327 | 279,783 | 57,028 | 14,148 | 3,127 |
SY 2017 Table 11.7 Gender Status of Ownership, CNMI: 2012
Statistical Yearbook 2017 CNMI CSD
“N”: Not available or not comparable
“X”: Not applicable (for the Commodity Flow Survey, not applicable or comparison data unavailable)
“S”: Withheld because estimate did not meet publication standards.
“D”: Withheld to avoid disclosing data for individual companies; data are included in higher level totals
| Sector | Meaning of 2012 NAICS code | Number of establishments | Value of sales, receipts, revenue, shipments, or business done ($1,000) | Annual payroll ($1,000) | First-quarter payroll ($1,000) | Paid employees for pay period including March 12 (number) |
|---|---|---|---|---|---|---|
| Source: U.S. Census Bureau, 2012 Economic Census of Island Areas | ||||||
| Construction | Female-owned | 10 | 1,567 | 370 | 101 | 152 |
| Construction | Male-owned | 34 | 30,483 | 6,339 | 1,663 | 575 |
| Construction | 50/50 Male/Female | 5 | 2,570 | 425 | 100 | b |
| Construction | Gender unknown | 2 | D | D | D | a |
| Construction | Gender unreported | 11 | 2,567 | 501 | 127 | 51 |
| Manufacturing | Female-owned | 5 | 1,986 | 869 | 215 | 106 |
| Manufacturing | Male-owned | 18 | 10,107 | 2,993 | 724 | 281 |
| Manufacturing | 50/50 Male/Female | 6 | 5,135 | 1,811 | 447 | 146 |
| Manufacturing | Gender unknown | 0 | 0 | 0 | 0 | 0 |
| Manufacturing | Gender unreported | 10 | 3,658 | 1,026 | 351 | 58 |
| Wholesale trade | Female-owned | 14 | 40,374 | 1,853 | 436 | 154 |
| Wholesale trade | Male-owned | 30 | 61,801 | 4,555 | 1,068 | 298 |
| Wholesale trade | 50/50 Male/Female | 5 | 3,671 | 677 | 185 | 52 |
| Wholesale trade | Gender unknown | 5 | 111,525 | 1,724 | 492 | 62 |
| Wholesale trade | Gender unreported | 20 | 29,457 | 1,938 | 506 | 149 |
| Retail trade | Female-owned | 64 | 49,952 | 4,488 | 1,081 | 486 |
| Retail trade | Male-owned | 109 | 75,678 | 10,378 | 2,451 | 820 |
| Retail trade | 50/50 Male/Female | 31 | 41,822 | 4,820 | 1,196 | 406 |
| Retail trade | Gender unknown | 5 | 95,701 | 5,435 | 1,853 | 236 |
| Retail trade | Gender unreported | 75 | 50,914 | 5,542 | 1,422 | 516 |
| Transportation and warehousing | Female-owned | 3 | D | D | D | a |
| Transportation and warehousing | Male-owned | 13 | 9,849 | 3,334 | 985 | 292 |
| Transportation and warehousing | 50/50 Male/Female | 0 | 0 | 0 | 0 | 0 |
| Transportation and warehousing | Gender unknown | 5 | D | D | D | e |
| Transportation and warehousing | Gender unreported | 5 | 3,044 | 696 | 199 | 33 |
| Information | Female-owned | 2 | D | D | D | a |
| Information | Male-owned | 11 | 3,144 | 1,343 | 309 | 65 |
| Information | 50/50 Male/Female | 0 | 0 | 0 | 0 | 0 |
| Information | Gender unknown | 1 | D | D | D | b |
| Information | Gender unreported | 6 | D | D | D | c |
| Finance and insurance | Female-owned | 5 | 1,470 | 444 | 111 | 24 |
| Finance and insurance | Male-owned | 19 | 31,216 | 3,056 | 784 | 130 |
| Finance and insurance | 50/50 Male/Female | 9 | 6,210 | 2,783 | 705 | 94 |
| Finance and insurance | Gender unknown | 7 | 9,781 | 1,260 | 335 | 49 |
| Finance and insurance | Gender unreported | 7 | 8,884 | 1,016 | 302 | 31 |
| Real estate and rental and leasing | Female-owned | 55 | 9,360 | 2,712 | 558 | 213 |
| Real estate and rental and leasing | Male-owned | 64 | 9,879 | 2,605 | 622 | 243 |
| Real estate and rental and leasing | 50/50 Male/Female | 22 | 3,687 | 1,065 | 263 | 79 |
| Real estate and rental and leasing | Gender unknown | 11 | 3,507 | 828 | 209 | 51 |
| Real estate and rental and leasing | Gender unreported | 25 | 4,243 | 1,096 | 280 | 108 |
| Professional, scientific, and technical services | Female-owned | 8 | 1,472 | 527 | 136 | 38 |
| Professional, scientific, and technical services | Male-owned | 55 | 16,020 | 5,182 | 1,354 | 374 |
| Professional, scientific, and technical services | 50/50 Male/Female | 10 | 1,427 | 591 | 132 | 33 |
| Professional, scientific, and technical services | Gender unknown | 3 | 427 | 119 | 27 | 14 |
| Professional, scientific, and technical services | Gender unreported | 29 | 9,355 | 3,290 | 745 | 143 |
| Management of companies and enterprises | Female-owned | 0 | 0 | 0 | 0 | 0 |
| Management of companies and enterprises | Male-owned | 0 | 0 | 0 | 0 | 0 |
| Management of companies and enterprises | 50/50 Male/Female | 0 | 0 | 0 | 0 | 0 |
| Management of companies and enterprises | Gender unknown | 1 | D | D | D | a |
| Management of companies and enterprises | Gender unreported | 3 | D | D | D | b |
| Administrative and support and waste management and remediation services | Female-owned | 24 | 4,803 | 2,568 | 692 | 250 |
| Administrative and support and waste management and remediation services | Male-owned | 45 | 12,141 | 4,469 | 1,137 | 387 |
| Administrative and support and waste management and remediation services | 50/50 Male/Female | 14 | 2,573 | 1,062 | 259 | 97 |
| Administrative and support and waste management and remediation services | Gender unknown | 4 | 7,874 | 3,884 | 924 | 336 |
| Administrative and support and waste management and remediation services | Gender unreported | 28 | 23,522 | 5,706 | 1,381 | 326 |
| Educational services | Female-owned | 6 | 1,482 | 359 | 90 | b |
| Educational services | Male-owned | 15 | 1,688 | 579 | 138 | 47 |
| Educational services | 50/50 Male/Female | 6 | 494 | 127 | 35 | a |
| Educational services | Gender unknown | 1 | D | D | D | a |
| Educational services | Gender unreported | 15 | 1,191 | 442 | 121 | 49 |
| Health care and social assistance | Female-owned | 7 | 2,125 | 1,023 | 205 | 60 |
| Health care and social assistance | Male-owned | 11 | 6,841 | 2,627 | 486 | 160 |
| Health care and social assistance | 50/50 Male/Female | 8 | 3,764 | 1,682 | 452 | 131 |
| Health care and social assistance | Gender unknown | 1 | D | D | D | a |
| Health care and social assistance | Gender unreported | 9 | D | D | D | e |
| Arts, entertainment, and recreation | Female-owned | 6 | 6,394 | 1,248 | 247 | 72 |
| Arts, entertainment, and recreation | Male-owned | 17 | 14,336 | 2,308 | 577 | 171 |
| Arts, entertainment, and recreation | 50/50 Male/Female | 7 | 5,973 | 1,001 | 259 | b |
| Arts, entertainment, and recreation | Gender unknown | 1 | D | D | D | c |
| Arts, entertainment, and recreation | Gender unreported | 12 | 4,535 | 807 | 198 | 85 |
| Accommodation and food services | Female-owned | 26 | 7,168 | 1,952 | 437 | 222 |
| Accommodation and food services | Male-owned | 61 | 67,885 | 13,237 | 3,223 | 1,225 |
| Accommodation and food services | 50/50 Male/Female | 7 | 3,066 | 1,032 | 268 | 113 |
| Accommodation and food services | Gender unknown | 7 | 65,284 | 13,084 | 3,470 | 865 |
| Accommodation and food services | Gender unreported | 41 | 36,573 | 8,456 | 2,403 | 770 |
| Other services (except public administration) | Female-owned | 26 | 4,176 | 1,103 | 259 | 113 |
| Other services (except public administration) | Male-owned | 46 | 10,575 | 3,167 | 736 | 281 |
| Other services (except public administration) | 50/50 Male/Female | 8 | 996 | 256 | 68 | 31 |
| Other services (except public administration) | Gender unknown | 4 | D | D | D | a |
| Other services (except public administration) | Gender unreported | 31 | 4,638 | 1,807 | 420 | 143 |
Ch.11 TRADE
To download, right click the chart and select “Save Image As”…