DescriptionTable DataChart and Figure Data
Ch.11 TRADE
Ch.11 TRADE
SY 2017 Table 11.9 Percent Distribution of sales, receipts, or revenue by Sector, CNMI: 2012
Statistical Yearbook 2017 CNMI CSD
| Class of Customer and Sector | Constructiion | Manufacturing | Wholesale trade |
Retail trade |
Transport and warehousing |
Information | Finance | Real estate and leasing |
Professional and scientific |
Administrative support |
Educational serivces |
Health care |
Arts and entertainment |
Accommodation and food |
Others |
|---|---|---|---|---|---|---|---|---|---|---|---|---|---|---|---|
| Source: 2012 CNMI Economic Census | |||||||||||||||
| Household consumers (Excluding visiting tourists.) | 4.3 | 19.4 | 15.9 | 36.8 | 4.9 | 46.2 | 25.2 | 20 | 28.2 | 5.6 | 3 | 50.1 | 23.9 | 14.1 | 29.9 |
| Retailers | 4 | 13.4 | 31.7 | 8.4 | 10.2 | 7 | 14.6 | 6.9 | 4.6 | 3.9 | 1 | 1.8 | D | 2.9 | 8.6 |
| Wholesalers | D | 7.2 | 6.8 | 2.1 | 13.9 | 5.6 | 2.6 | 1.8 | 2 | 0.5 | 0 | 0.1 | 0 | 1.5 | 1.9 |
| Visiting tourists | 0 | 2.2 | 0.6 | 37.2 | 2.6 | 0 | 0.1 | 11.2 | 2.1 | 32.5 | 86.6 | 0.9 | 30.9 | 42.6 | 15.2 |
| Hotels or other traveler accommodations | 2.5 | 4.8 | 7.8 | 2.9 | 1.7 | 11.4 | 2.7 | 1 | 3.8 | 7.2 | 0 | 0 | 3 | 17.3 | 4.8 |
| Construction contractors | 24.8 | 6.6 | 2.1 | 0.9 | 1.4 | 3.2 | 1.7 | 1.9 | 6.4 | 0.5 | 0 | 0 | 0.3 | 0.2 | 10.4 |
| Farmers for farm use | 0 | D | 0 | 0.8 | 0 | D | 0 | 0.1 | 0 | 0 | 0 | 0 | 0 | 0 | 0 |
| Restaurants, food services, and nightclubs | 0.1 | 2.7 | 0.3 | 0.7 | D | D | 0.6 | 0.4 | 0.5 | 1.3 | 0 | 0 | 0 | 1.6 | 0.4 |
| Travel agencies and other passenger transportation services | 0 | 0.5 | 0.5 | 0.3 | 26.7 | 3.8 | 1 | 0.8 | 2 | 27.3 | 1.4 | 0.1 | 1.3 | 1.9 | 3.1 |
| Other service establishments including truck and passenger car rental and leasing | 0.5 | 2.9 | 0.3 | 0.6 | 4.1 | D | 0.4 | 2.7 | 2.4 | 1.3 | 0 | 0.2 | 0 | 0 | 1.5 |
| Apparel manufacturers | 0 | 0.7 | 0 | 0.1 | 0 | D | 0.1 | 0.1 | 0.1 | 0 | 0 | 0 | 0 | 0 | 0 |
| Other manufacturer establishments and quarries | 5.9 | 2.4 | 1.5 | 2.8 | 9.5 | 2.1 | 3.8 | 17.8 | 3 | 2.4 | 0 | D | 0 | 8.4 | 0 |
| Banks, insurance, and real estate companies | 0.1 | 0.9 | 0.1 | 0.8 | D | 4.2 | 2.5 | 4.7 | 5.3 | 0.6 | 0 | 0.6 | 0 | 0.2 | 1.2 |
| Governmental bodies | 53.8 | 34 | 22 | 4.4 | 10.7 | 7.3 | 1.3 | 6.8 | 19.1 | 4.5 | 0 | 7.5 | 14.1 | 2.1 | 7.4 |
| All other classes of customers | 3.9 | 2.4 | D | 1.2 | 13.1 | 1.3 | 43.5 | 23.9 | 20.6 | 12.5 | 8 | 38.4 | 25 | 7.4 | 15.6 |
SY 2017 Table 11.10 Capital Expenditures and Depreciation Charges by Sector, CNMI: 2012
Statistical Yearbook 2017 CNMI CSD
“D”: Withheld to avoid disclosing data for individual companies; data are included in higher level totals
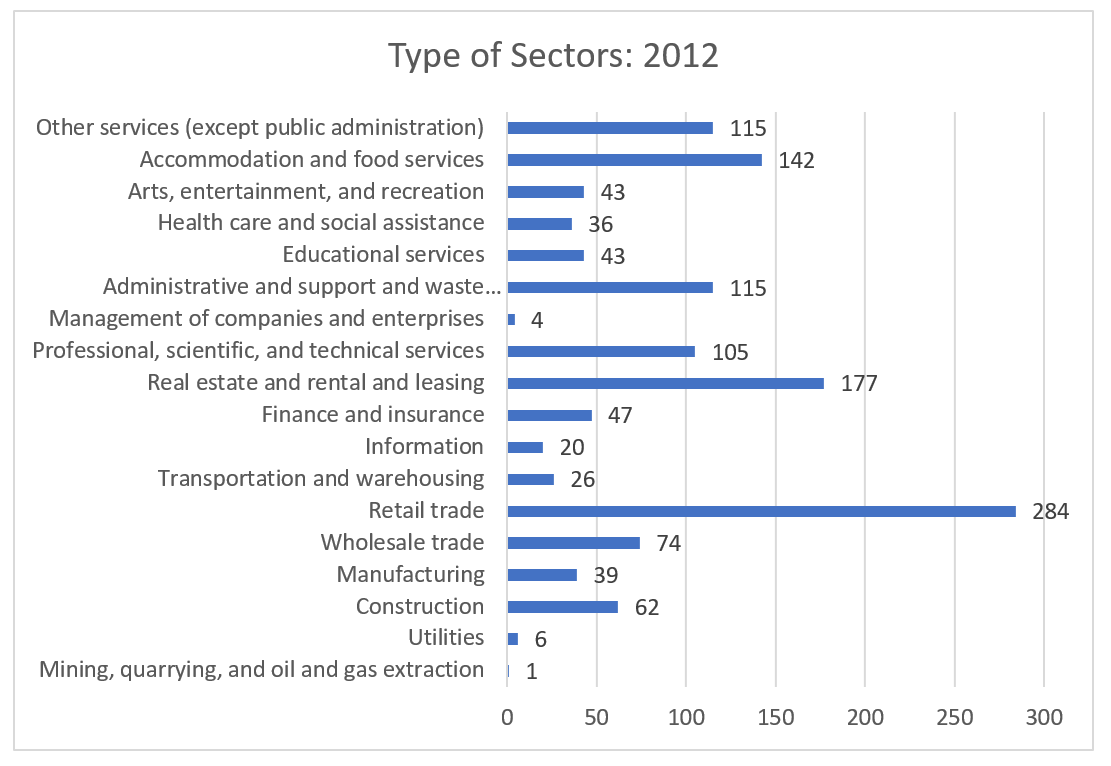
| Sector | Number of establishments | Value of sales, receipts, revenue, shipments, or business done ($1,000) | Total capital expenditures ($1,000) | Capital expenditures on buildings and other structures (new and used)($1,000) | Capital expenditures on machinery and equipment (new and used) ($1,000) | Depreciation charges ($1,000) |
|---|---|---|---|---|---|---|
| Source: U.S. Census Bureau, 2012 Economic Census of Island Areas | ||||||
| Mining, quarrying, and oil and gas extraction | 1 | D | D | D | D | D |
| Utilities | 6 | D | D | D | D | D |
| Construction | 62 | 37,230 | 4,707 | 2,254 | 2,452 | 1,761 |
| Manufacturing | 39 | 20,887 | 3,333 | 1,054 | 2,280 | 2,308 |
| Wholesale trade | 74 | 246,827 | 9,763 | 6,495 | 3,269 | 53,515 |
| Retail trade | 284 | 314,066 | 189,566 | 180,431 | 9,135 | 19,992 |
| Transportation and warehousing | 26 | 46,438 | 83,601 | 67,213 | 16,387 | 12,038 |
| Information | 20 | 25,138 | 8,643 | 6,744 | 1,899 | 1,061 |
| Finance and insurance | 47 | 57,560 | 18,051 | 10,805 | 7,246 | 6,432 |
| Real estate and rental and leasing | 177 | 30,675 | 89,263 | 84,729 | 4,534 | 11,952 |
| Professional, scientific, and technical services | 105 | 28,703 | 3,454 | 1,272 | 2,182 | 1,216 |
| Management of companies and enterprises | 4 | D | D | D | D | D |
| Administrative and support and waste management and remediation services | 115 | 50,913 | 4,071 | 1,669 | 2,401 | 3,105 |
| Educational services | 43 | 4,979 | 5,111 | 2,911 | 2,199 | 1,580 |
| Health care and social assistance | 36 | 41,349 | 15,719 | 10,118 | 5,601 | 2,440 |
| Arts, entertainment, and recreation | 43 | 37,467 | 7,377 | 3,450 | 3,928 | 10,404 |
| Accommodation and food services | 142 | 179,975 | 13,164 | 6,681 | 6,483 | 19,926 |
| Other services (except public administration) | 115 | 20,636 | 10,466 | 4,714 | 5,751 | 5,408 |
Ch.11 TRADE
To download, right click the chart and select “Save Image As”…