DescriptionTable DataChart and Figure Data
Ch.12 AGRICULTURE and FISHING
Ch.12 AGRICULTURE and FISHING
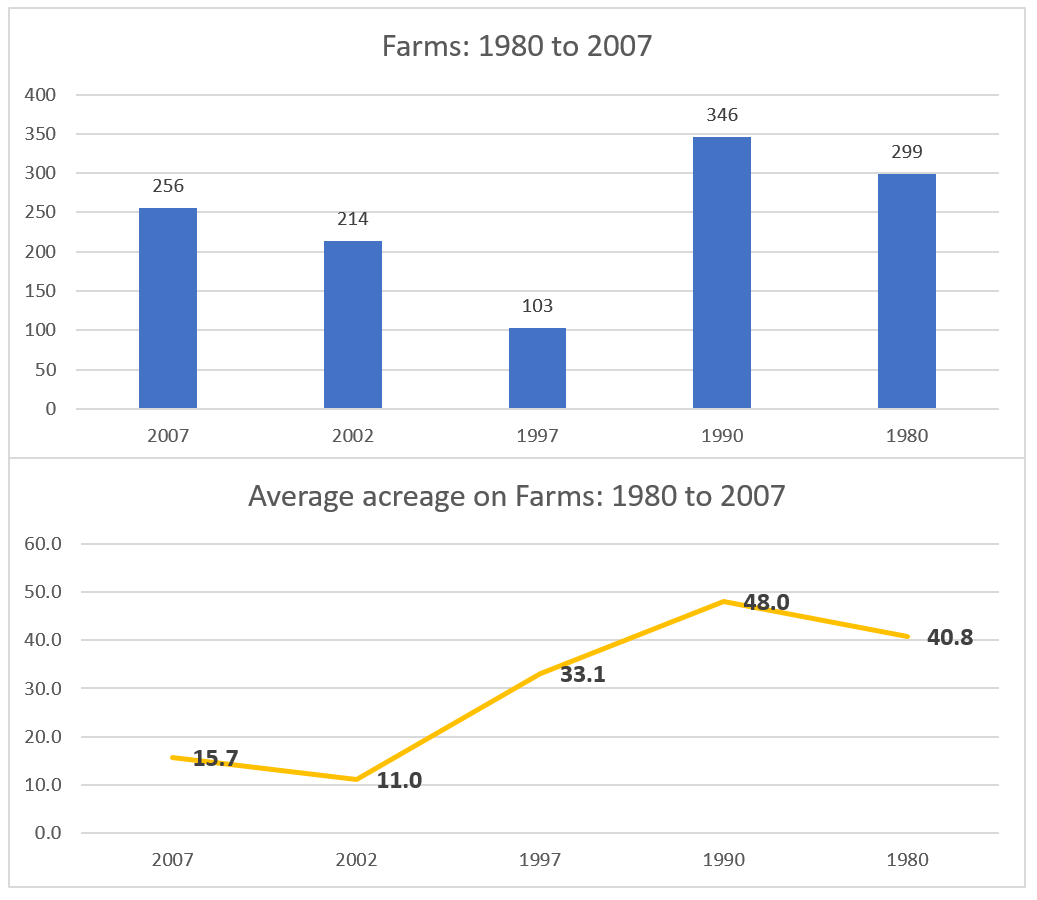
SY 2017 Table 12.1 Farms, Land in Farms and Land Use, CNMI: 1980 to 2007
Statistical Yearbook 2017 CNMI CSD
Note: Figures may not add to total due to rounding
| Land Use | Number of Farms 2007 |
Farm size (acres) 2007 |
Number of Farms 2002 |
Farm size (acres) 2002 |
Number of Farms 1997 |
Farm size (acres) 1997 |
Number of Farms 1990 |
Farm size (acres) 1990 |
Number of Farms 1980 |
Farm size (acres) 1980 |
|---|---|---|---|---|---|---|---|---|---|---|
| Source: 1998 Census of Agriculture AC97 -A- 56, Table 1, 2007 Agriculture Report, and earlier Agriculture Census Reports | ||||||||||
| Farms | 256 | 214 | 103 | … | 346 | … | 299 | … | ||
| Land in farms’ | … | 4,013 | … | 2,353 | … | 3,413 | … | 16,442 | … | 12,187 |
| Average size of farm | … | 16 | … | 11 | … | 33 | … | 48 | … | 41 |
| Approximate land area | … | 117,760 | … | 117,760 | … | 117,760 | … | 117,760 | … | 117,760 |
| Proportion in farms (percent) | … | 3 | … | 2 | … | 33 | … | 14 | … | 10 |
| Cropland | 213 | 773 | 194 | 882 | 88 | 490 | 281 | 5,235 | 289 | 2,643 |
| Used for crops | 208 | 538 | 189 | 529 | 84 | 413 | 270 | 769 | 280 | 950 |
| Used for other purposes | 91 | 235 | 117 | 353 | 20 | 40 | 80 | 4,466 | 146 | 1,693 |
| Pastureland, except cropland pastured | 75 | 2,955 | 60 | 1,222 | 22 | 2,681 | 124 | 5,534 | 129 | 8,706 |
| Other land | 157 | 283 | 190 | 248 | 43 | 156 | 218 | 3,673 | 132 | 839 |
Ch.12 AGRICULTURE and FISHING
To download, right click the chart and select “Save Image As”…