DescriptionTable DataChart and Figure Data
Ch.12 AGRICULTURE and FISHING
Ch.12 AGRICULTURE and FISHING
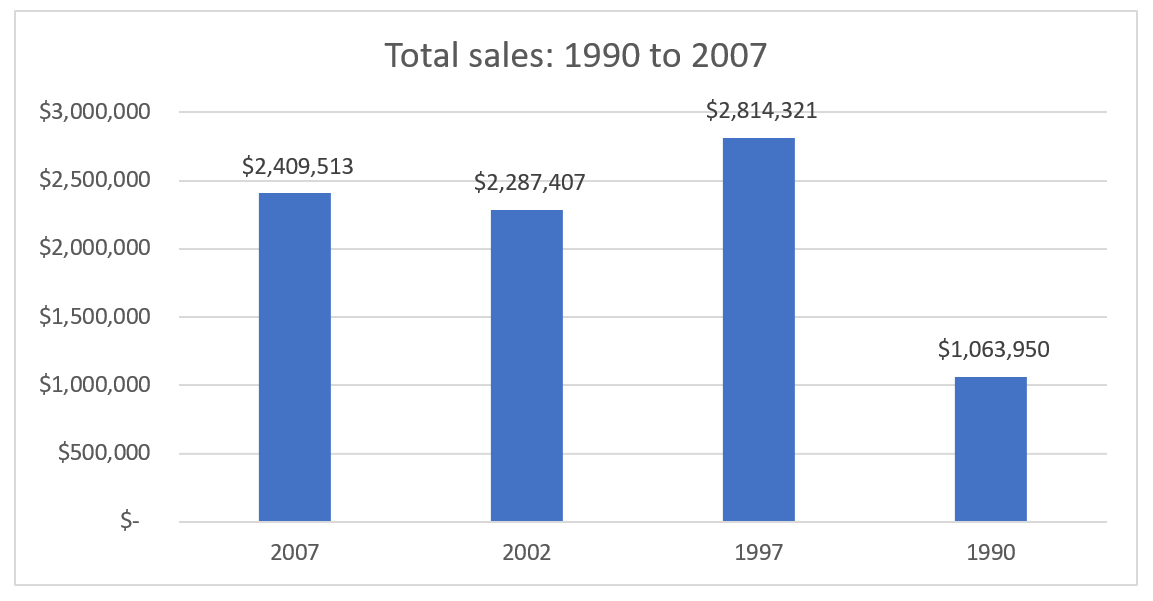
SY 2017T Table 12.4 Market Value of Agricultural Products Sold, CNMI: 1990 to 2007
Statistical Yearbook 2017 CNMI CSD
| Farms by Value of Sales: | Farms 2007 |
Value ($) 2007 |
Farms 2002 |
Value ($) 2002 |
Farms 1997 |
Value ($) 1997 |
Farms 1990 |
Value ($) 1990 |
|---|---|---|---|---|---|---|---|---|
| Source: 1997 Census of Agriculture, AC97-A-56, Table 6 and 2007 Agriculture Census Report | ||||||||
| Less than $1,200 | 20 | $24,385 | 19 | $19,640 | 7 | $7,387 | 43 | $19,405 |
| $1,200 to $2,499 | 68 | $114,952 | 55 | $95,818 | 14 | $23,099 | 22 | $40,518 |
| $2,500 to $4,999 | 49 | $174,365 | 44 | $151,614 | 18 | $58,804 | 23 | $73,930 |
| $5,000 to $7,499 | 42 | $249,645 | 23 | $134,878 | 17 | $97,854 | 5 | $32,386 |
| $7,500 to $9,999 | 18 | $153,950 | 17 | $140,537 | 4 | $35,882 | 3 | $24,840 |
| $10,000 or more | 59 | $1,692,216 | 56 | $1,744,920 | 43 | $2,591,295 | 23 | $872,771 |
| Average Sales | $9,412 | $10,689 | (x) | $27,324 | (x) | $8,941 |
SY 2017 Table 12.4 Market Value of Agricultural Products Sold, CNMI: 1990 to 2007
Statistical Yearbook 2017 CNMI CSD
Note: “D” means data withheld to avoid disclosing figures for individual establishments; data are included in higher level totals
| Sales by commodity group or product | Farms 2007 |
Value ($) 2007 |
Farms 2002 |
Value ($) 2002 |
Farms 1997 |
Value ($) 1997 |
Farms 1990 |
Value ($) 1990 |
|---|---|---|---|---|---|---|---|---|
| Source: 1997 Census of Agriculture, AC97-A-56, Table 6 and 2007 Agriculture Census Report | ||||||||
| Root crops | 106 | $638,498 | 85 | $404,734 | 43 | $129,201 | N/A | N/A |
| Sales of $500 or more | 84 | $633,728 | 74 | $633,728 | 29 | $126,199 | N/A | N/A |
| Vegetables and melons | 110 | $631,470 | 102 | $821,293 | 79 | $1,217,972 | N/A | N/A |
| Sales of $500 or more | 94 | $627,295 | 84 | $816,883 | 72 | $1,216,115 | N/A | N/A |
| Fruits and nuts | 115 | $401,664 | 103 | $343,021 | 36 | $251,550 | 47 | $155,341 |
| Sales of $500 or more | 95 | $397,359 | 82 | $338,085 | 23 | $248,679 | 28 | $152,307 |
| Nursery crops (inc. ornamentals) | 17 | $178,311 | 10 | $93,997 | 7 | (D) | 8 | $58,885 |
| Sales of $500 or more | 15 | $177,781 | 9 | $92,997 | 6 | (D) | 7 | (D) |
| Livestock | 98 | $279,485 | 71 | $475,187 | 37 | $390,905 | 37 | $367,383 |
| Sales of $500 or more | 93 | $277,910 | 62 | $472,517 | 35 | (D) | 26 | $364,628 |
| Poultry and eggs | 18 | $214,360 | 32 | $143,795 | 9 | $712,423 | 8 | $12,115 |
| Sales of $500 or more | 7 | $34,075 | 23 | $141,725 | 5 | $712,153 | 4 | $11,550 |
| Fish and aquaculture products | 5 | $65,725 | 5 | $64,150 | 1 | (D) | 0 | $- |
| Sales of $500 or more | 4 | $65,600 | 3 | $5,550 | 1 | (D) | 0 | $- |
Ch.12 AGRICULTURE and FISHING
To download, right click the chart and select “Save Image As”…