DescriptionTable DataChart and Figure Data
Ch.12 AGRICULTURE and FISHING
Ch.12 AGRICULTURE and FISHING
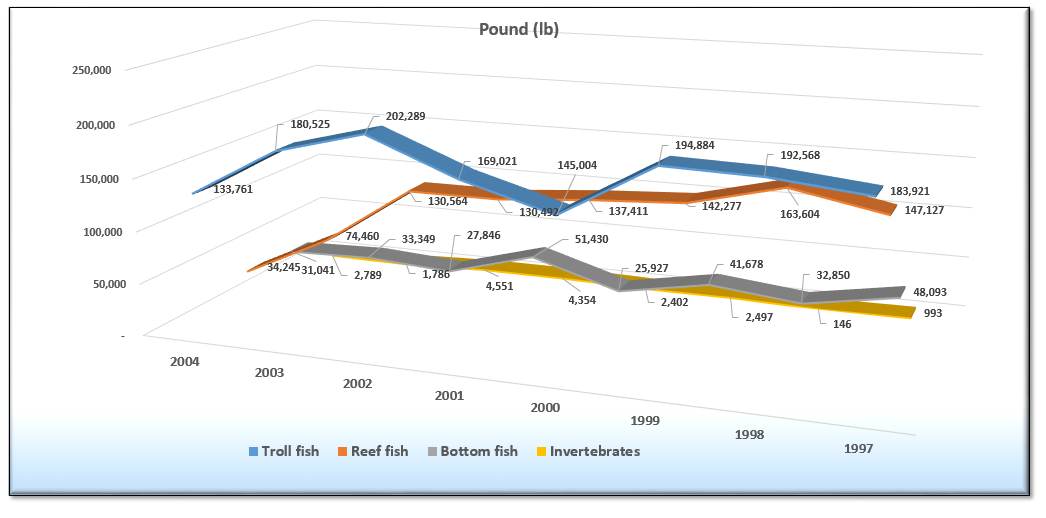
SY 2017 Table 12.7 Commercial Fish Landings by Pound, CNMI: 1997 to 2004
Statistical Yearbook 2017 CNMI CSD
| Pound (lb) | 2004 | 2003 | 2002 | 2001 | 2000 | 1999 | 1998 | 1997 |
|---|---|---|---|---|---|---|---|---|
| Source: DLNR, Division of Fish & Wildlife | ||||||||
| Troll fish | 133,761 | 180,525 | 202,289 | 169,021 | 145,004 | 194,884 | 192,568 | 183,921 |
| Reef fish | 34,245 | 74,460 | 130,564 | 130,492 | 137,411 | 142,277 | 163,604 | 147,127 |
| Bottom fish | 31,041 | 33,349 | 27,846 | 51,430 | 25,927 | 41,678 | 32,850 | 48,093 |
| Invertebrates | 2,789 | 1,786 | 4,551 | 4,354 | 2,402 | 2,497 | 146 | 993 |
.
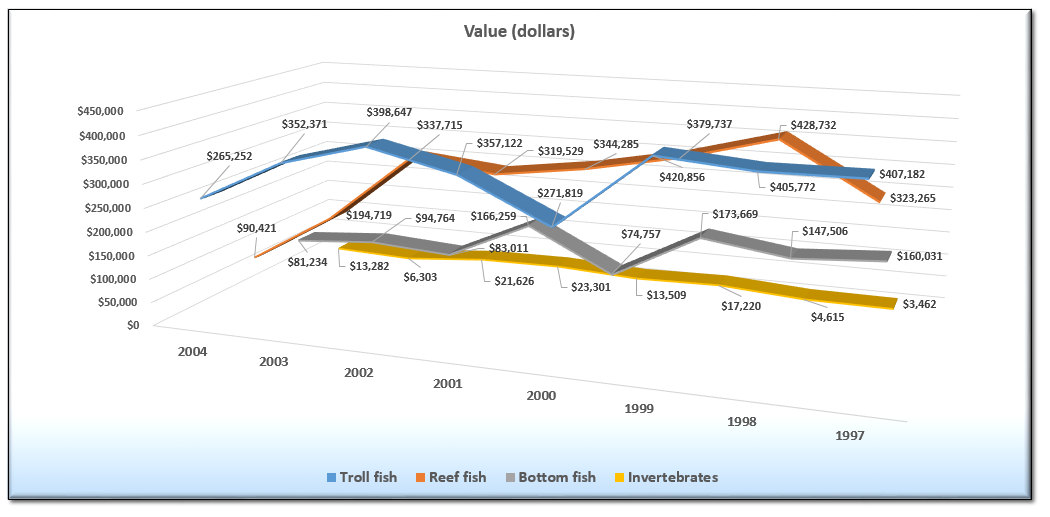
SY 2017 Table 12.7 Commercial Fish Landings by Value in Dollars, CNMI: 1997 to 2004
Statistical Yearbook 2017 CNMI CSD
| Value (dollars) | 2004 | 2003 | 2002 | 2001 | 2000 | 1999 | 1998 | 1997 |
|---|---|---|---|---|---|---|---|---|
| Source: DLNR, Division of Fish & Wildlife | ||||||||
| Troll fish | $265,252 | $352,371 | $398,647 | $357,122 | $271,819 | $420,856 | $405,772 | $407,182 |
| Reef fish | $90,421 | $194,719 | $337,715 | $319,529 | $344,285 | $379,737 | $428,732 | $323,265 |
| Bottom fish | $81,234 | $94,764 | $83,011 | $166,259 | $74,757 | $173,669 | $147,506 | $160,031 |
| Invertebrates | $13,282 | $6,303 | $21,626 | $23,301 | $13,509 | $17,220 | $4,615 | $3,462 |
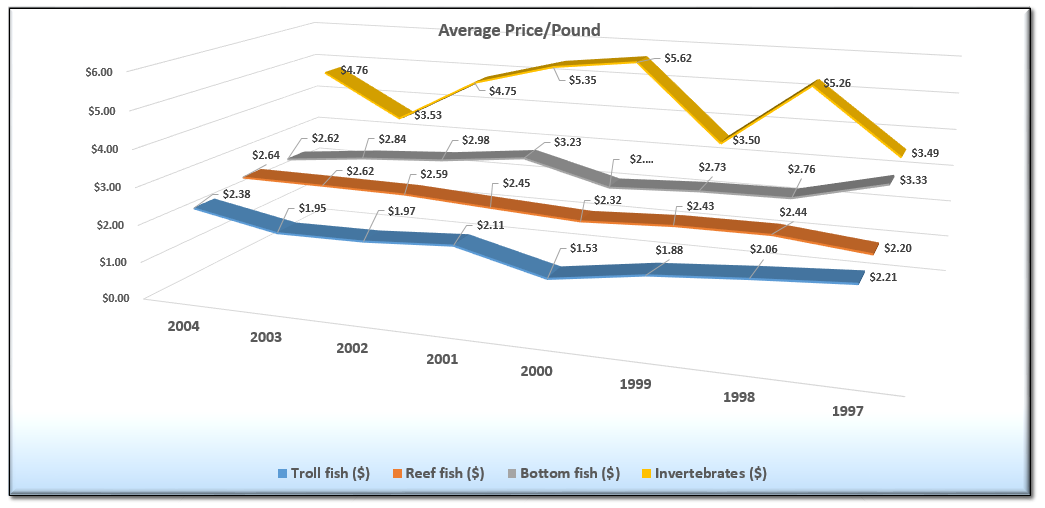
SY 2017 Table 12.7 Commercial Fish Landings by Average Price, CNMI: 1997 to 2004
Statistical Yearbook 2017 CNMI CSD
| Average price/pound | 2004 | 2003 | 2002 | 2001 | 2000 | 1999 | 1998 | 1997 |
|---|---|---|---|---|---|---|---|---|
| Source: DLNR, Division of Fish & Wildlife | ||||||||
| Troll fish ($) | $2.38 | $1.95 | $1.97 | $2.11 | $1.53 | $1.88 | $2.06 | $2.21 |
| Reef fish ($) | $2.64 | $2.62 | $2.59 | $2.45 | $2.32 | $2.43 | $2.44 | $2.20 |
| Bottom fish ($) | $2.62 | $2.84 | $2.98 | $3.23 | $2.62 | $2.73 | $2.76 | $3.33 |
| Invertebrates ($) | $4.76 | $3.53 | $4.75 | $5.35 | $5.62 | $3.50 | $5.26 | $3.49 |
Ch.12 AGRICULTURE and FISHING
To download, right click the chart and select “Save Image As”…