DescriptionTable DataChart and Figure Data
Ch.13 GOVERNMENT ACCOUNTS
Ch.13 GOVERNMENT ACCOUNTS
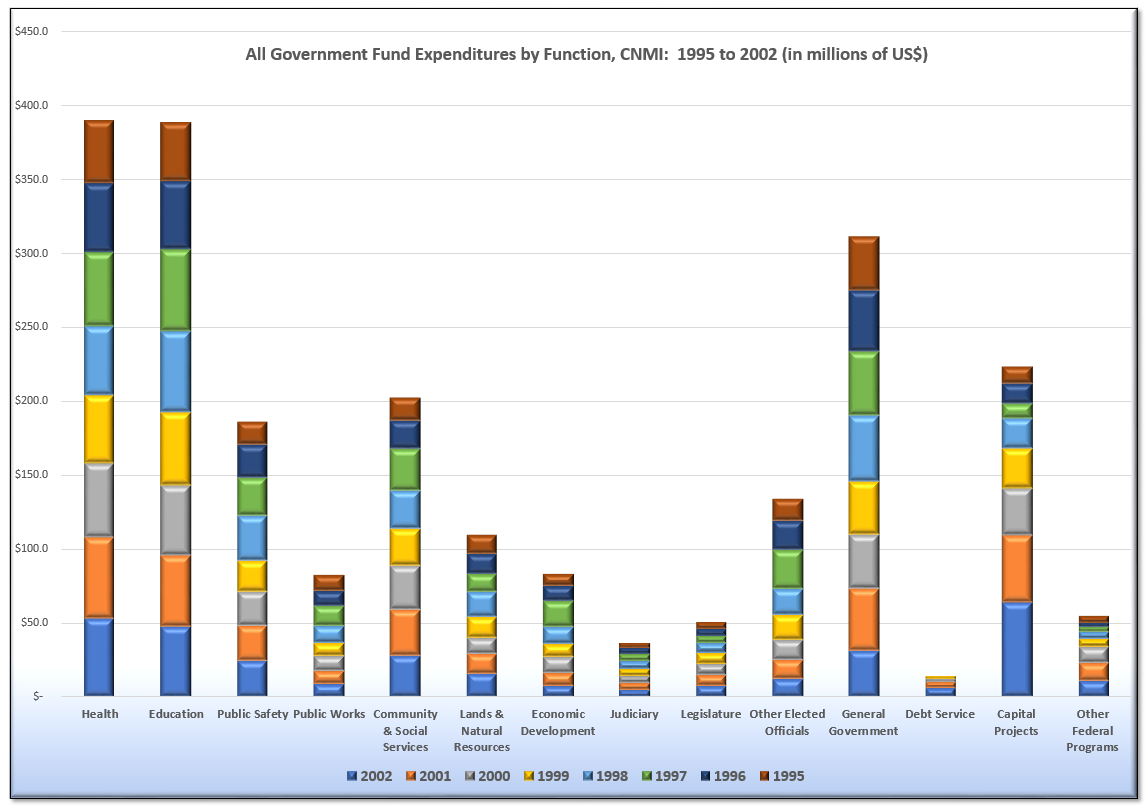
SY 2017 Table 13.2 All Government Fund Expenditures by Function, CNMI: 1993 to 2002
Statistical Yearbook 2017 CNMI CSD
Note: The amounts in millions of US$
Note: FY 2002 Unaudited Finance Data
Note: FY 2003 data was not submitted
Note: Public School System and Northern Marianas College federal grants expenditures are not included above
| Expenditures | 2002 | 2001 | 2000 | 1999 | 1998 | 1997 | 1996 | 1995 | 1994 | 1993 |
|---|---|---|---|---|---|---|---|---|---|---|
| Source: Department of Finance | ||||||||||
| Health | $52.4 | $55.4 | $49.9 | $46.0 | $46.8 | $50.2 | $46.2 | $42.5 | $46.7 | $44.9 |
| Education | $47.4 | $48.2 | $47.1 | $49.4 | $54.8 | $55.6 | $46.0 | $40.0 | $39.4 | $35.2 |
| Public Safety | $24.3 | $24.0 | $22.8 | $21.0 | $30.3 | $25.9 | $21.9 | $15.6 | $14.0 | $14.4 |
| Public Works | $8.7 | $9.1 | $10.0 | $8.9 | $11.3 | $13.4 | $10.4 | $10.8 | $6.3 | $6.2 |
| Community & Social Services | $27.7 | $31.3 | $29.5 | $25.0 | $26.1 | $27.9 | $19.0 | $15.6 | $13.5 | $9.0 |
| Lands & Natural Resources | $15.8 | $13.1 | $10.9 | $14.3 | $16.6 | $12.6 | $13.4 | $12.9 | $7.1 | $8.6 |
| Economic Development | $7.5 | $8.9 | $10.6 | $8.5 | $11.7 | $17.9 | $10.3 | $7.7 | $8.3 | $8.0 |
| Judiciary | $4.8 | $4.8 | $4.6 | $4.6 | $5.5 | $4.8 | $4.2 | $3.5 | $2.9 | $2.0 |
| Legislature | $7.2 | $7.8 | $7.5 | $7.1 | $6.7 | $4.8 | $4.9 | $4.8 | $4.8 | $4.9 |
| Other Elected Officials | $12.4 | $12.9 | $13.1 | $17.1 | $17.4 | $26.4 | $19.9 | $15.0 | $14.9 | $12.0 |
| General Government | $30.9 | $41.8 | $36.9 | $36.0 | $44.5 | $43.0 | $41.9 | $36.1 | $35.5 | $25.9 |
| Debt Service | $5.9 | $3.9 | $2.3 | $2.0 | $- | $- | $- | $- | $- | $- |
| Capital Projects | $63.3 | $45.7 | $31.5 | $27.4 | $20.3 | $10.1 | $13.3 | $11.6 | $19.3 | $24.6 |
| Other Federal Programs | $10.5 | $12.4 | $10.6 | $5.9 | $4.3 | $3.5 | $3.1 | $4.3 | $5.2 | $2.1 |
| Transfer PSS Bond Proceeds | $- | $- | $- | $15.0 | $- | $- | $- | $- | $- | $- |
Ch.13 GOVERNMENT ACCOUNTS
To download, right click the chart and select “Save Image As”…