DescriptionTable DataChart and Figure Data
Ch.13 GOVERNMENT ACCOUNTS
Ch.13 GOVERNMENT ACCOUNTS
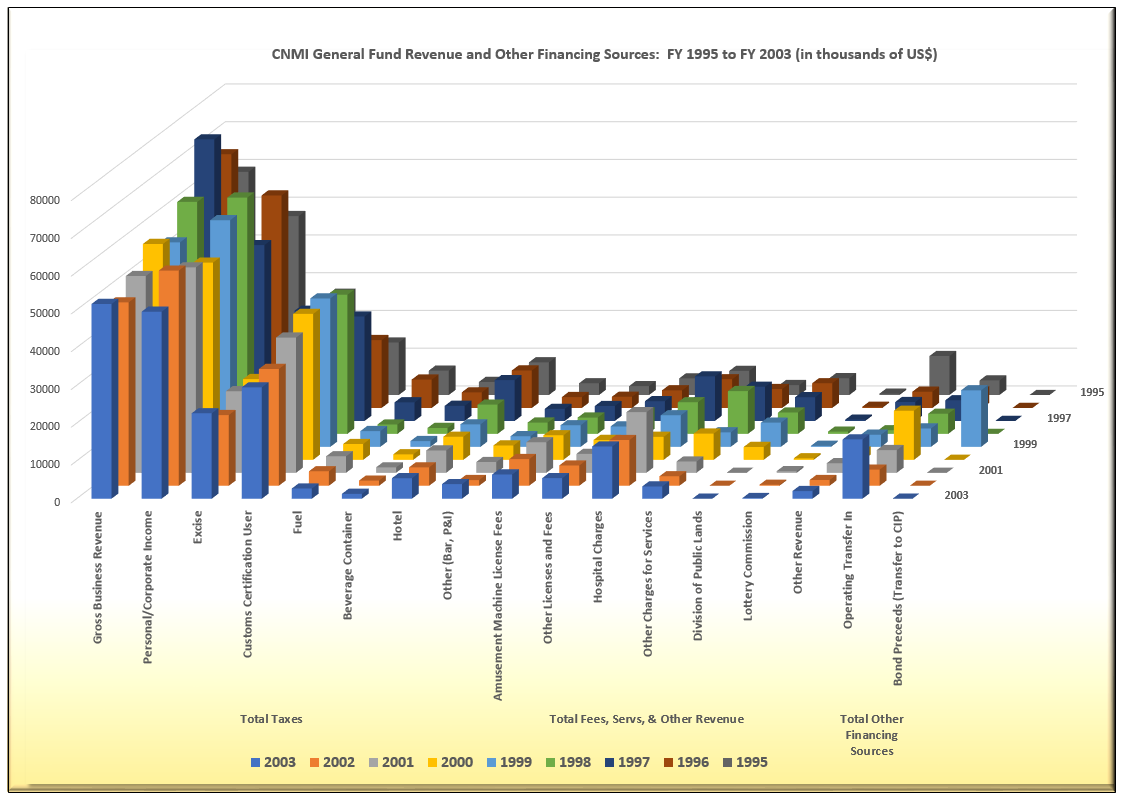
SY 2017 Table 13.3 CNMI General Fund Revenue and Other Financing Sources: FY 1995 to 2003
Statistical Yearbook 2017 CNMI CSD
Note: The amounts in thousands of US$
Note: FY 2002 and FY 2003 Unaudited Finance Data
| Revenue Type | 2003 | 2002 | 2001 | 2000 | 1999 | 1998 | 1997 | 1996 | 1995 | |
|---|---|---|---|---|---|---|---|---|---|---|
| Source: Department of Finance | ||||||||||
| Taxes | Gross Business Revenue | $51,584 | $48,565 | $52,122 | $57,180 | $54,157 | $61,443 | $74,568 | $67,187 | $59,104 |
| Taxes | Personal/Corporate Income | $49,527 | $56,971 | $54,392 | $52,220 | $60,036 | $62,589 | $46,564 | $56,288 | $47,386 |
| Taxes | Excise | $22,637 | $18,726 | $21,611 | $21,391 | $19,883 | $24,308 | $29,175 | $25,007 | $26,818 |
| Taxes | Customs Certification User | $29,491 | $30,929 | $35,816 | $38,644 | $39,311 | $36,846 | $27,653 | $17,981 | $13,897 |
| Taxes | Fuel | $2,704 | $3,833 | $4,374 | $4,182 | $4,183 | $2,486 | $4,925 | $7,524 | $6,459 |
| Taxes | Beverage Container | $1,290 | $1,354 | $1,439 | $1,461 | $1,527 | $1,568 | $3,998 | $4,130 | $3,461 |
| Taxes | Hotel | $5,432 | $4,865 | $5,923 | $6,116 | $5,958 | $7,744 | $10,800 | $9,932 | $8,656 |
| Taxes | Other (Bar, P&I) | $3,858 | $1,507 | $2,850 | $3,802 | $2,829 | $3,000 | $3,196 | $2,892 | $3,110 |
| Fees, Servs, & Other Revenue | Amusement Machine License Fees | $6,422 | $7,063 | $8,083 | $6,510 | $5,719 | $4,329 | $3,949 | $2,971 | $2,347 |
| Fees, Servs, & Other Revenue | Other Licenses and Fees | $5,446 | $5,368 | $5,005 | $5,268 | $5,411 | $5,699 | $5,232 | $4,674 | $4,396 |
| Fees, Servs, & Other Revenue | Hospital Charges | $13,824 | $12,109 | $16,061 | $6,090 | $8,364 | $8,371 | $11,806 | $7,601 | $6,385 |
| Fees, Servs, & Other Revenue | Other Charges for Services | $3,258 | $2,514 | $2,984 | $6,957 | $3,847 | $11,337 | $9,058 | $5,011 | $2,637 |
| Fees, Servs, & Other Revenue | Division of Public Lands | $- | $- | $- | $3,416 | $6,413 | $5,658 | $6,293 | $6,541 | $4,448 |
| Fees, Servs, & Other Revenue | Lottery Commission | $193 | $271 | $427 | $394 | $275 | $603 | $337 | $313 | $348 |
| Fees, Servs, & Other Revenue | Other Revenue | $2,031 | $1,522 | $2,538 | $2,194 | $3,222 | $962 | $5,007 | $4,303 | $10,327 |
| Other Financing Sources | Operating Transfer In | $15,714 | $4,267 | $6,013 | $13,002 | $4,879 | $5,339 | $5,475 | $4,346 | $3,871 |
| Other Financing Sources | Bond Preceeds (Transfer to CIP) | $- | $- | $- | $- | $14,980 | $- | $- | $- | $- |
Ch.13 GOVERNMENT ACCOUNTS
To download, right click the chart and select “Save Image As”…


