DescriptionTable DataChart and Figure Data
Ch.13 GOVERNMENT ACCOUNTS
Ch.13 GOVERNMENT ACCOUNTS
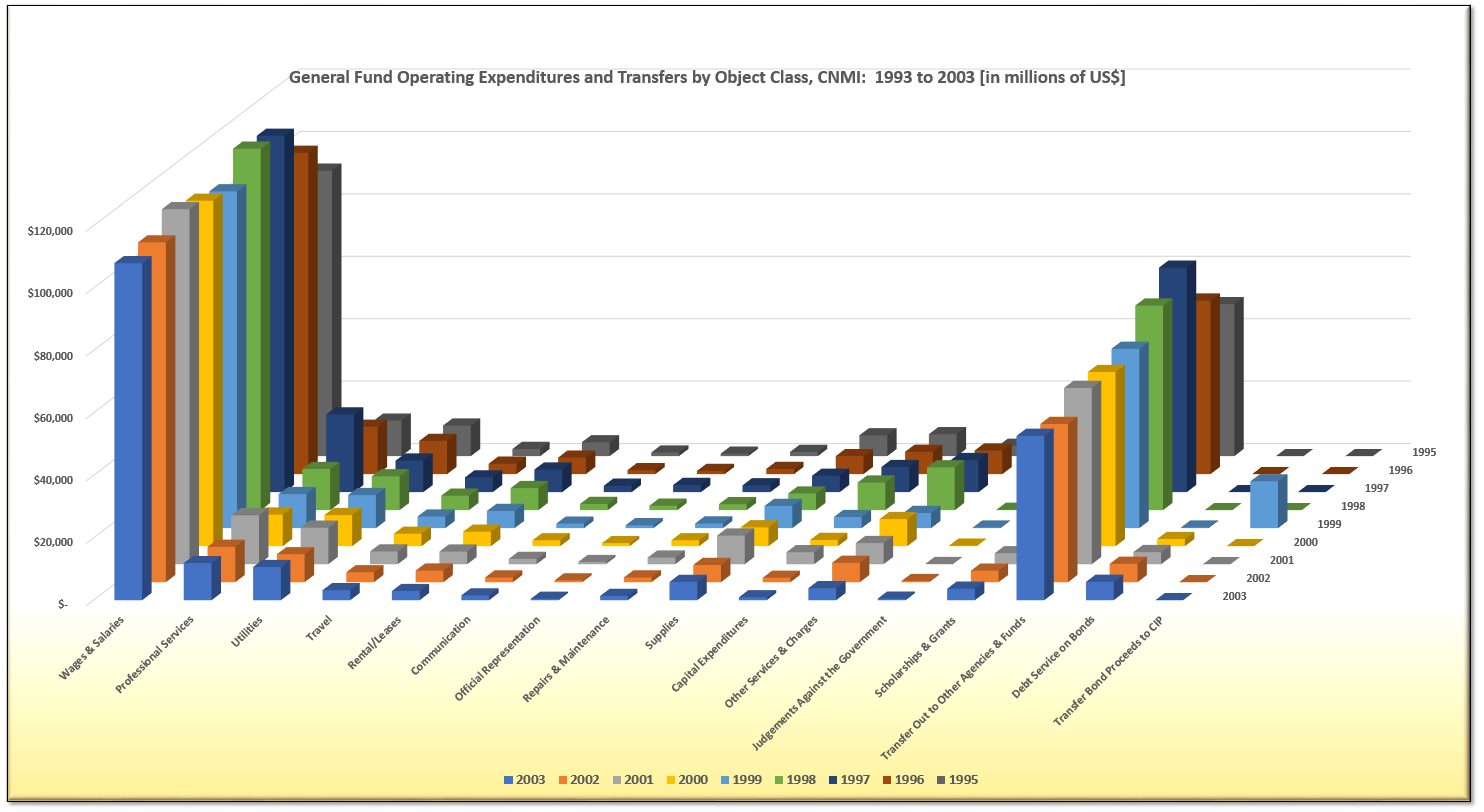
SY 2017 Table 13.5 General Fund Operating Expenditures and Transfers by Object Class, CNMI: 1993 to 2003
Statistical Yearbook 2017 CNMI CSD
Note: The amounts in millions of US$
Note: Data for 2002 and 2003 Unaudited Finance Data
| 2003 | 2002 | 2001 | 2000 | 1999 | 1998 | 1997 | 1996 | 1995 | ||
|---|---|---|---|---|---|---|---|---|---|---|
| Source: Department of Finance | ||||||||||
| Expenditures | Wages & Salaries | $107,975 | $108,859 | $113,739 | $110,662 | $107,920 | $115,795 | $114,180 | $102,944 | $91,442 |
| Expenditures | Professional Services | $11,875 | $11,317 | $15,641 | $10,126 | $10,920 | $13,173 | $24,898 | $15,150 | $11,372 |
| Expenditures | Utilities | $10,624 | $8,948 | $11,678 | $9,965 | $10,609 | $10,840 | $10,103 | $10,645 | $9,802 |
| Expenditures | Travel | $3,199 | $3,172 | $4,067 | $3,969 | $3,727 | $4,629 | $4,729 | $3,340 | $2,306 |
| Expenditures | Rental/Leases | $2,945 | $3,709 | $4,022 | $4,627 | $5,509 | $7,061 | $7,230 | $5,288 | $4,438 |
| Expenditures | Communication | $1,541 | $1,512 | $1,698 | $1,895 | $1,443 | $1,979 | $2,063 | $1,284 | $1,159 |
| Expenditures | Official Representation | $460 | $565 | $688 | $970 | $946 | $1,433 | $2,304 | $1,023 | $773 |
| Expenditures | Repairs & Maintenance | $1,369 | $1,525 | $2,104 | $1,891 | $1,500 | $1,892 | $2,184 | $1,668 | $1,341 |
| Expenditures | Supplies | $5,866 | $5,512 | $9,162 | $6,046 | $7,115 | $5,334 | $5,224 | $5,761 | $6,664 |
| Expenditures | Capital Expenditures | $942 | $1,414 | $3,839 | $2,000 | $3,564 | $8,842 | $8,055 | $7,156 | $7,035 |
| Expenditures | Other Services & Charges | $3,837 | $6,194 | $6,766 | $8,665 | $4,858 | $13,731 | $10,269 | $7,536 | $3,297 |
| Expenditures | Judgements Against the Government | $500 | $366 | $48 | $143 | $201 | $104 | $418 | $268 | $478 |
| Expenditures | Scholarships & Grants | $3,690 | $3,696 | $3,487 | $2,997 | $3,593 | $5,284 | $4,553 | $4,045 | $2,650 |
| Transfers & Debt Service | Transfer Out to Other Agencies & Funds | $52,651 | $50,695 | $56,460 | $55,789 | $57,462 | $65,551 | $71,912 | $55,607 | $48,689 |
| Transfers & Debt Service | Debt Service on Bonds | $5,873 | $5,873 | $3,883 | $2,295 | $200 | $- | $- | $- | $- |
| Transfers & Debt Service | Transfer Bond Proceeds to CIP | $- | $- | $- | $- | $14,980 | $- | $- | $- | $- |
Ch.13 GOVERNMENT ACCOUNTS
To download, right click the chart and select “Save Image As”…


