DescriptionTable DataChart and Figure Data
Ch.16 INSULAR AREAS
Ch.16 INSULAR AREAS
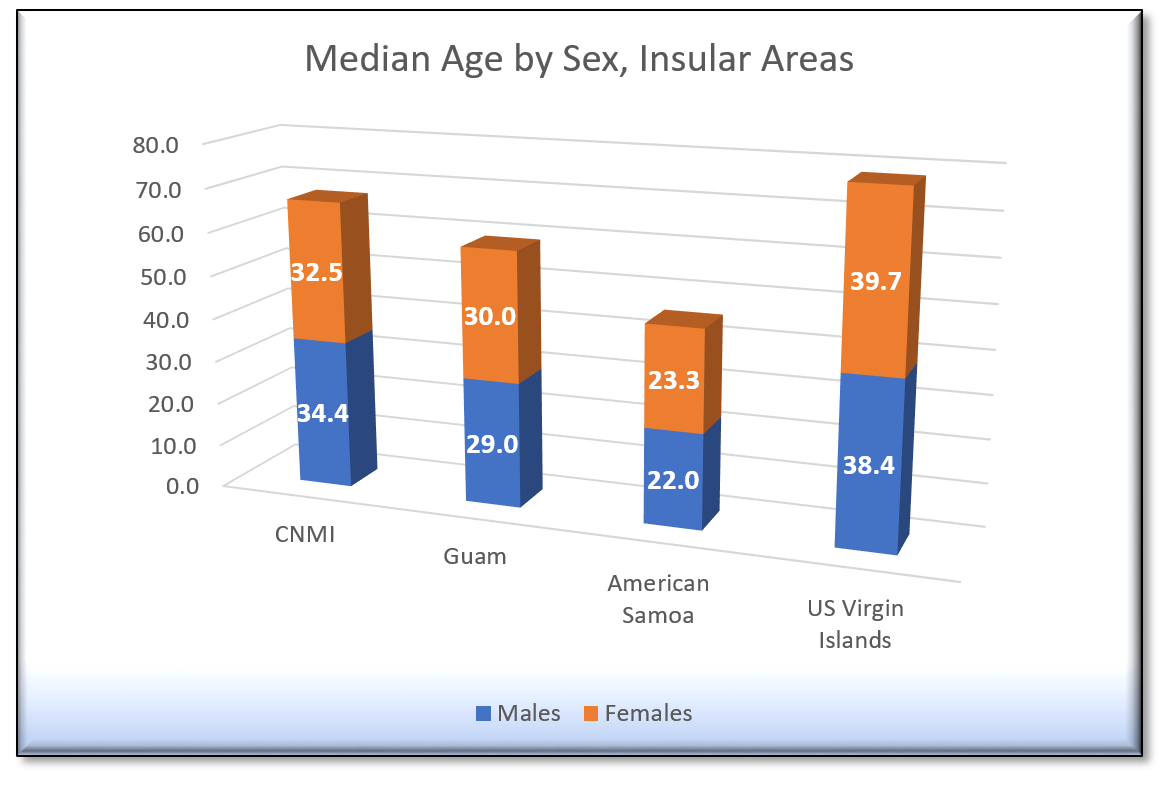
SY 2017 Table 16.2 Population in Insular Areas by Age and Sex: 2010 (MALE)
Statistical Yearbook 2017 CNMI CSD
Universe: Total population
| Male Age | CNMI | Guam | American Samoa | US Virgin Islands |
|---|---|---|---|---|
| Source: U.S. Census Bureau | ||||
| Under 5 years | 2,476 | 7,345 | 3,417 | 3,736 |
| 5 to 9 years | 2,339 | 7,200 | 3,470 | 3,694 |
| 10 to 14 years | 2,589 | 7,777 | 3,214 | 3,849 |
| 15 to 19 years | 2,199 | 7,473 | 3,218 | 3,767 |
| 20 to 24 years | 1,321 | 6,678 | 1,944 | 2,704 |
| 25 to 29 years | 1,321 | 5,431 | 1,670 | 2,698 |
| 30 to 34 years | 1,846 | 5,151 | 1,724 | 2,831 |
| 35 to 39 years | 2,481 | 5,753 | 1,844 | 3,132 |
| 40 to 44 years | 2,978 | 6,161 | 1,795 | 3,507 |
| 45 to 49 years | 2,756 | 5,821 | 1,673 | 3,678 |
| 50 to 54 years | 2,288 | 4,758 | 1,336 | 3,800 |
| 55 to 59 years | 1,435 | 3,828 | 1,014 | 3,343 |
| 60 to 64 years | 882 | 3,181 | 754 | 3,516 |
| 65 to 69 years | 387 | 1,934 | 500 | 2,884 |
| 70 to 74 years | 251 | 1,411 | 323 | 1,737 |
| 75 to 79 years | 114 | 838 | 158 | 1,043 |
| 80 to 84 years | 60 | 525 | 75 | 569 |
| 85 years and over | 23 | 303 | 41 | 379 |
SY 2017 Table 16.2 Population in Insular Areas by Age and Sex: 2010 (FEMALE)
Statistical Yearbook 2017 CNMI CSD
Universe: Total population
| Female Age | CNMI | Guam | American Samoa | US Virgin Islands |
|---|---|---|---|---|
| Source: U.S. Census Bureau | ||||
| Under 5 years | 2,351 | 6,944 | 3,194 | 3,764 |
| 5 to 9 years | 2,274 | 6,784 | 3,065 | 3,456 |
| 10 to 14 years | 2,332 | 7,269 | 3,065 | 3,635 |
| 15 to 19 years | 2,051 | 6,934 | 3,079 | 3,796 |
| 20 to 24 years | 1,349 | 5,701 | 1,946 | 3,191 |
| 25 to 29 years | 1,706 | 5,315 | 1,655 | 3,276 |
| 30 to 34 years | 2,052 | 5,195 | 1,782 | 3,312 |
| 35 to 39 years | 2,576 | 5,651 | 1,760 | 3,538 |
| 40 to 44 years | 2,788 | 5,498 | 1,807 | 3,944 |
| 45 to 49 years | 2,253 | 5,251 | 1,714 | 4,052 |
| 50 to 54 years | 1,835 | 4,445 | 1,342 | 4,098 |
| 55 to 59 years | 1,177 | 3,887 | 1,043 | 3,845 |
| 60 to 64 years | 662 | 3,180 | 727 | 3,855 |
| 65 to 69 years | 312 | 1,955 | 457 | 2,970 |
| 70 to 74 years | 189 | 1,619 | 330 | 1,980 |
| 75 to 79 years | 136 | 1,146 | 182 | 1,283 |
| 80 to 84 years | 60 | 626 | 132 | 763 |
| 85 years and over | 34 | 390 | 69 | 780 |
Ch.16 INSULAR AREAS
To download, right click the chart and select “Save Image As”…