DescriptionTable DataChart and Figure Data
Ch.16 INSULAR AREAS
Ch.16 INSULAR AREAS
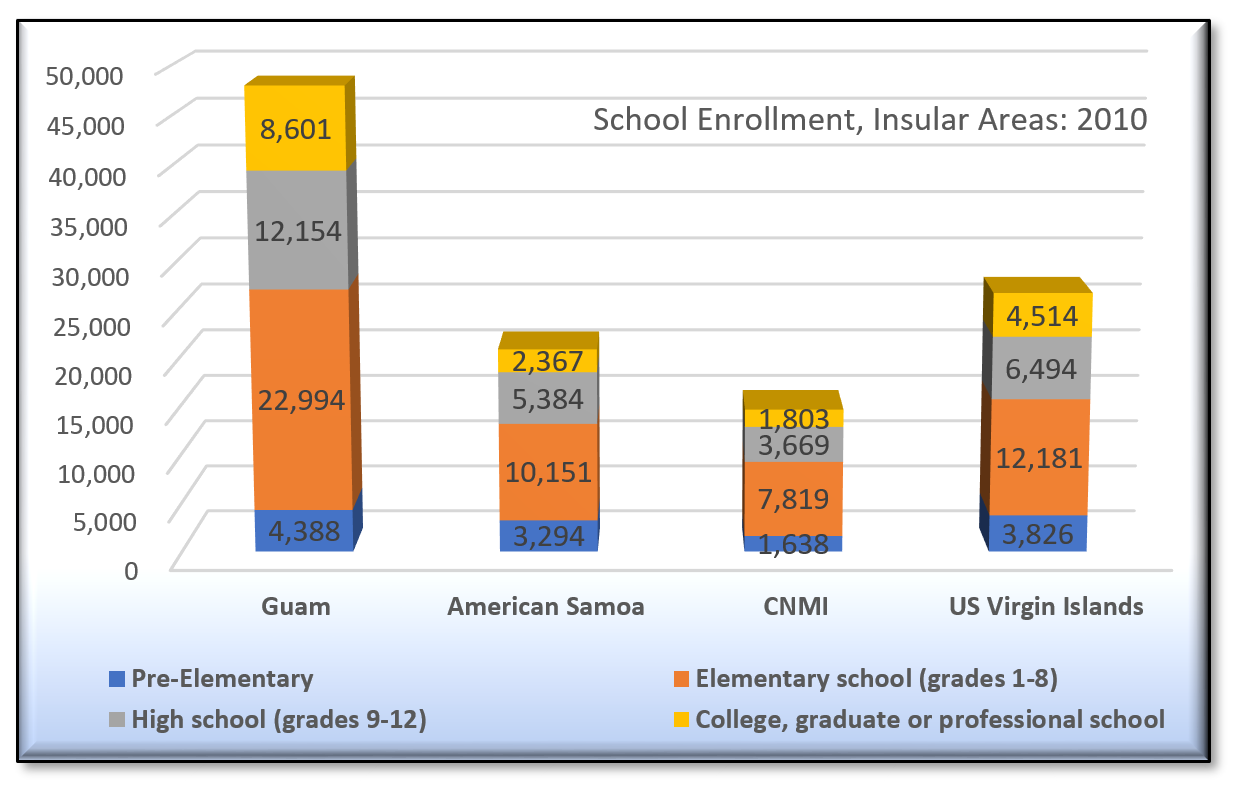
SY 2017 Table 16.3 School Enrollment, Insular Areas: 2010
Statistical Yearbook 2017 CNMI CSD
Universe: Population 3 years and over enrolled in school
| Characteristic | Guam | American Samoa | CNMI | US Virgin Islands |
|---|---|---|---|---|
| Source: U.S. Census Bureau | ||||
| Pre-kindergarten | 1,651 | 1,465 | 701 | 2,149 |
| Kindergarten | 2,737 | 1,829 | 937 | 1,677 |
| Elementary school (grades 1-8) | 22,994 | 10,151 | 7,819 | 12,181 |
| High school (grades 9-12) | 12,154 | 5,384 | 3,669 | 6,494 |
| College, graduate or professional school | 8,601 | 2,367 | 1,803 | 4,514 |
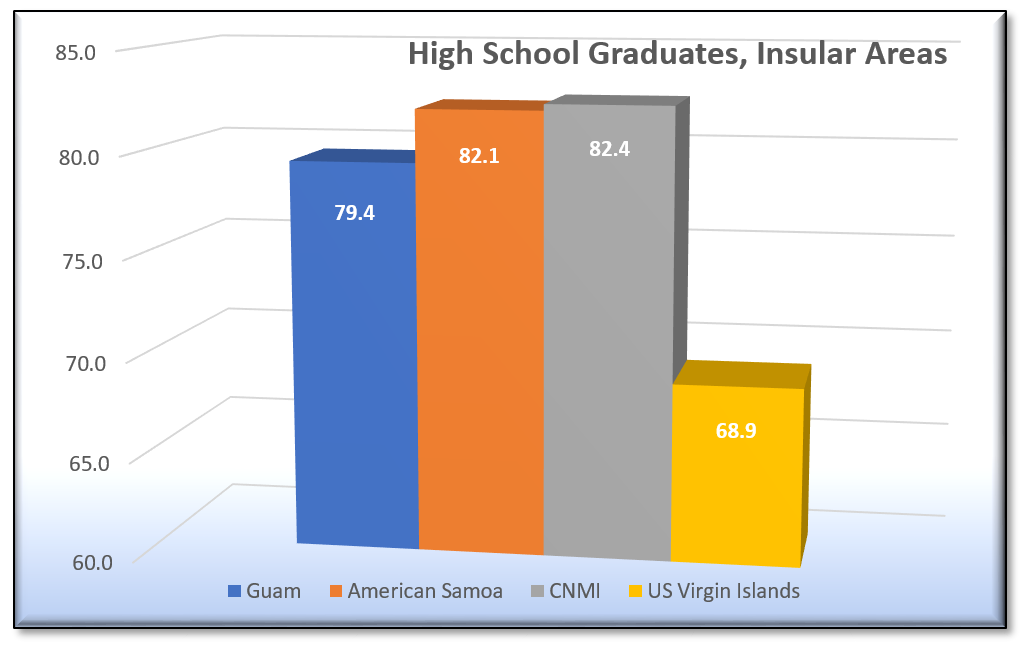
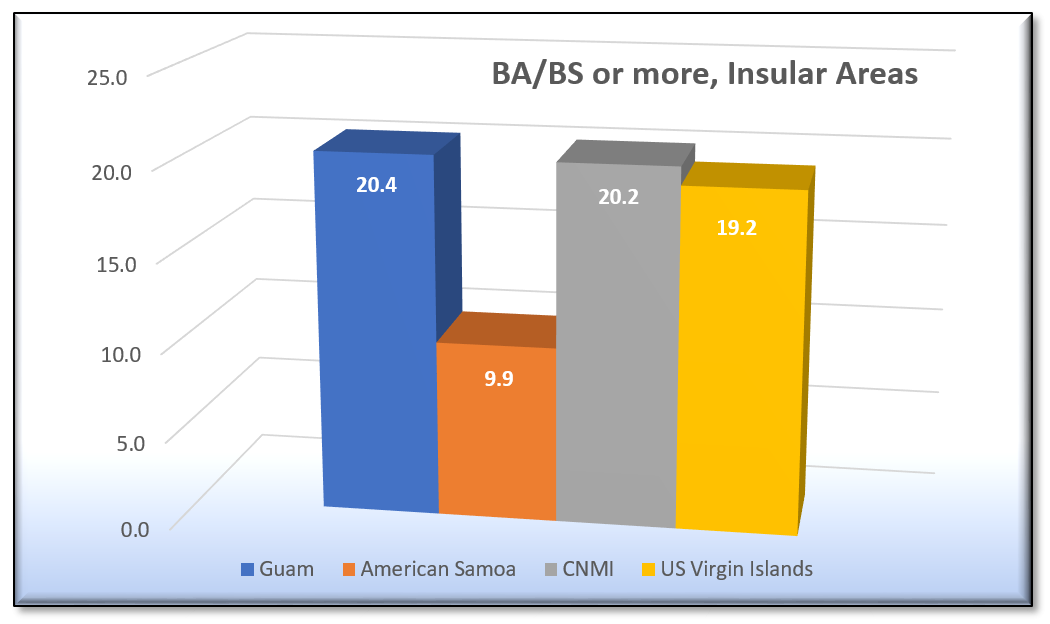
SY 2017 Table 16.4 Insular Areas by Educational Attainment: 2010
Statistical Yearbook 2017 CNMI CSD
Universe: Population 25 years and over
| Educational Attainment | Guam | Guam | American Samoa |
American Samoa |
CNMI | CNMI | US Virgin Islands |
US Virgin Islands |
|---|---|---|---|---|---|---|---|---|
| Source: U.S. Census Bureau | ||||||||
| Less than 9th grade | 6,919 | 100% | 1,775 | 100% | 2,550 | 100% | 11,543 | 100% |
| 9th to 12th grade, no diploma | 11,429 | 92.2% | 2,867 | 93.1% | 3,187 | 92.2% | 10,479 | 83.7% |
| High school graduate (includes equivalency) | 30,176 | 79.4% | 12,512 | 82.1% | 12,063 | 82.4% | 21,598 | 68.9% |
| Some college, no degree | 17,587 | 45.6% | 3,952 | 33.8% | 5,987 | 45.4% | 10,505 | 38.4% |
| Associate’s degree | 4,963 | 25.9% | 2,227 | 18.5% | 2,230 | 27.0% | 3,109 | 23.6% |
| Bachelor’s degree | 13,513 | 20.4% | 1,668 | 9.9% | 5,383 | 20.2% | 8,350 | 19.2% |
| Graduate or professional degree | 4,666 | 5.2% | 906 | 3.5% | 1,202 | 3.7% | 5,229 | 7.4% |
Ch.16 INSULAR AREAS
To download, right click the chart and select “Save Image As”…


