DescriptionTable DataChart and Figure Data
Ch.16 INSULAR AREAS
Ch.16 INSULAR AREAS
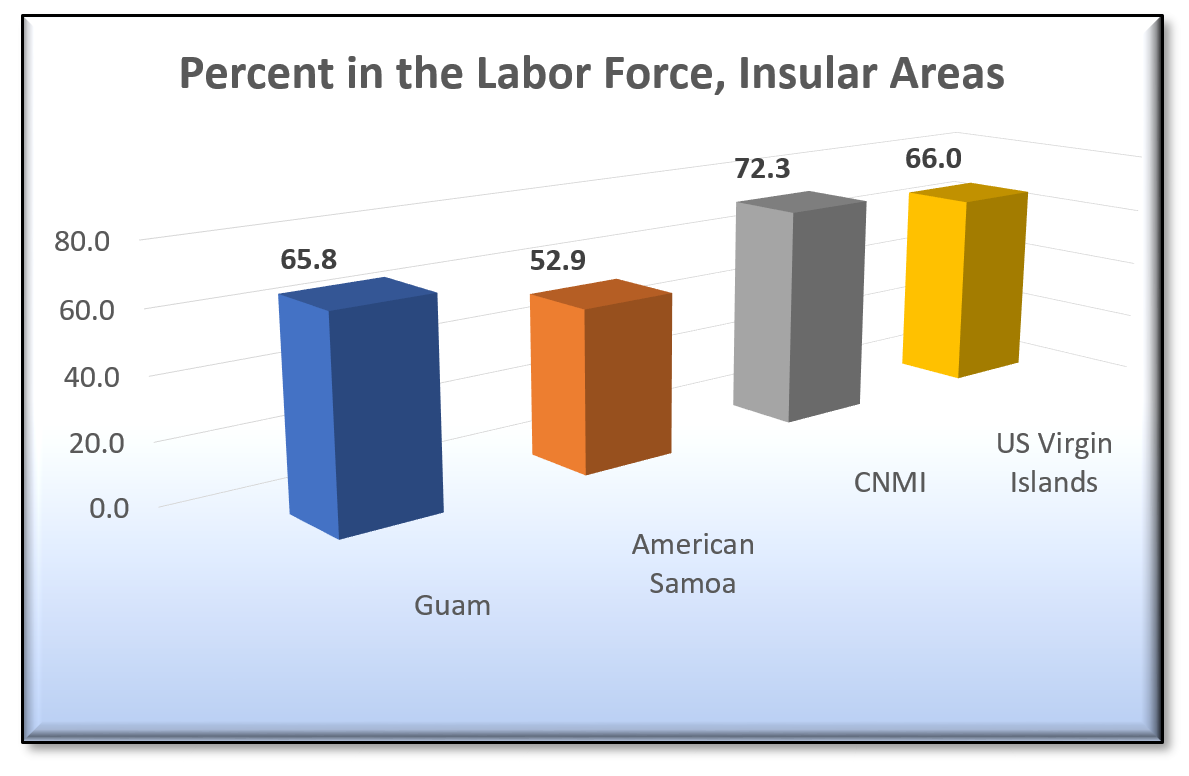
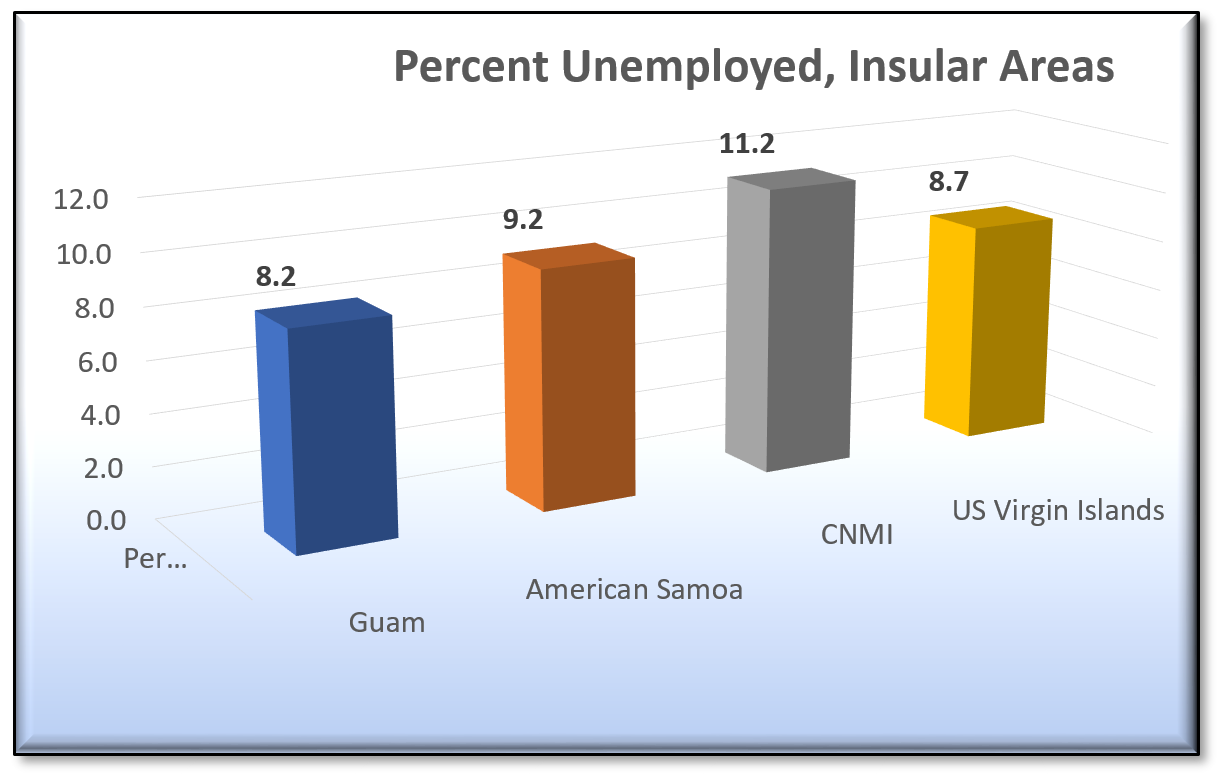
SY 2017 Table 16.6 Employment Status and Subsistence Activity, Insular Areas: 2010
Statistical Yearbook 2017 CNMI CSD
Universe: Population 16 years and over
Note: “*” Data not collected or data not comparable due to question or response choice differences
| Guam | American Samoa | CNMI | US Virgin Islands | ||
|---|---|---|---|---|---|
| Source: U.S. Census Bureau | |||||
| In labor force | Civilian Employed | 63,678 | 16,616 | 24,826 | 49,588 |
| In labor force | (Also did subsistence activity) | 2,606 | 1,614 | 1,136 | * |
| In labor force | Civilian Unemployed | 5,716 | 1,684 | 3,123 | 4,700 |
| In labor force | Armed Forces | 5,006 | 87 | 19 | 253 |
| Not in labor force | Not in labor force | 38,667 | 16,380 | 10,711 | 28,093 |
| Not in labor force | Subsistence activity only | 710 | 633 | 234 | * |
| In labor force | Percent | 65.8% | 52.9% | 72.3% | 66.0% |
| Unemployed | Percent | 8.2% | 9.2% | 11.2% | 8.7% |
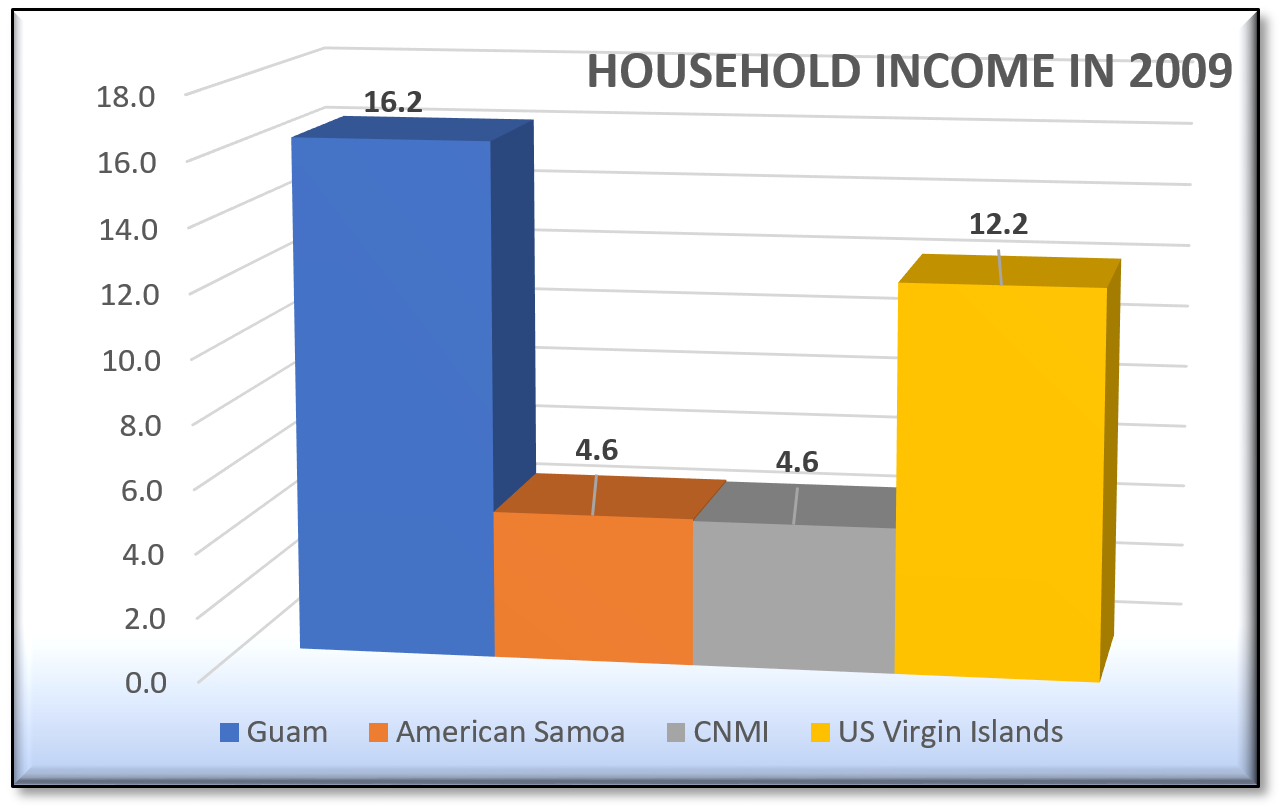
SY 2017 Table 16.7 HOUSEHOLD INCOME IN 2009
Statistical Yearbook 2017 CNMI CSD
Universe: Households
Note: “*” Data not collected or data not comparable due to question or response choice differences
| Demographic Profile Subject | Guam | American Samoa | CNMI | US Virgin Islands |
|---|---|---|---|---|
| Source: U.S. Census Bureau | ||||
| Less than $2,500 | 1,726 | 504 | 903 | * |
| $2,500 to $4,999 | 552 | 182 | 558 | * |
| $5,000 to $9,999 | 1,278 | 1,087 | 2,529 | 2,649 |
| $10,000 to $14,999 | 2,007 | 1,203 | 2,097 | 2,977 |
| $15,000 to $19,999 | 2,217 | * | * | * |
| $20,000 to $24,999 | 2,418 | * | * | * |
| $25,000 to $29,999 | 2,387 | 739 | 982 | * |
| $30,000 to $39,999 | 4,811 | 1,169 | 1,554 | * |
| $40,000 to $49,999 | 4,237 | 740 | 1,099 | * |
| $50,000 to $59,999 | 3,782 | * | * | * |
| $60,000 to $69,999 | 3,249 | * | * | * |
| $70,000 to $79,999 | 2,598 | * | * | * |
| $80,000 to $99,999 | 3,939 | * | * | * |
| $100,000 or more | 6,825 | 449 | 734 | 5,267 |
Ch.16 INSULAR AREAS
To download, right click the chart and select “Save Image As”…