Ch.21 CHAMORRO in U.S.
Ch.21 CHAMORRO in U.S.
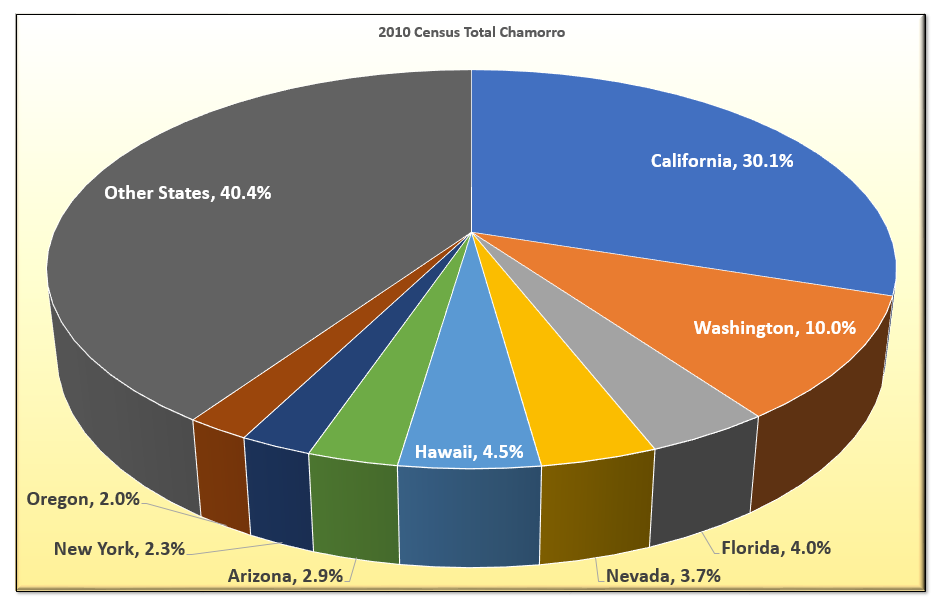
SY 2017 Table 21.1 Chamorro Population, United States and Insular Areas: 2010
Statistical Yearbook 2017 CNMI CSD
NOTE: Chamorro – “Guamanian or Chamorro” selected or written entries “Guam” or “Chamorro” (2000 and 2010 Census definition)
NOTE: Part-Chamorro – Chamorro and one or more additional race (2000 and 2010 Census definition)
| Total Population | Chamorro | Part-Chamorro | |
|---|---|---|---|
| Source: 1980, 1990, 2000 and 2010 Censuses of Population and Housing | |||
| United States | 281,421,906 | 88,310 | 59,488 |
| California | 33,871,648 | 24,299 | 20,126 |
| Washington | 5,894,121 | 9,746 | 5,083 |
| Texas | 20,851,820 | 6,591 | 3,576 |
| Florida | 15,982,378 | 3,747 | 2,157 |
| Nevada | 1,998,257 | 3,513 | 1,999 |
| Georgia | 8,186,453 | 2,746 | 1,110 |
| Hawaii | 1,211,537 | 2,700 | 3,947 |
| Arizona | 5,130,632 | 2,646 | 1,630 |
| North Carolina | 8,049,313 | 2,505 | 1,177 |
| New York | 18,976,457 | 2,235 | 1,172 |
| Virginia | 7,078,515 | 2,222 | 1,370 |
| Colorado | 4,301,261 | 1,784 | 1,272 |
| Alabama | 4,447,100 | 1,774 | 551 |
| Oregon | 3,421,399 | 1,755 | 1,259 |
| Tennessee | 5,689,283 | 1,507 | 617 |
| Maryland | 5,296,486 | 1,319 | 781 |
| Ohio | 11,353,140 | 1,145 | 832 |
| Illinois | 12,419,293 | 1,100 | 828 |
| South Carolina | 4,012,012 | 1,046 | 522 |
| Missouri | 5,595,211 | 969 | 582 |
| Pennsylvania | 12,281,054 | 968 | 637 |
| Oklahoma | 3,450,654 | 924 | 546 |
| New Jersey | 8,414,350 | 915 | 532 |
| Kentucky | 4,041,769 | 866 | 421 |
| Louisiana | 4,468,976 | 738 | 451 |
| Massachusetts | 6,349,097 | 671 | 508 |
| Indiana | 6,080,485 | 636 | 477 |
| Kansas | 2,688,418 | 571 | 431 |
| Mississippi | 2,844,658 | 560 | 257 |
| Idaho | 1,293,953 | 543 | 317 |
| Michigan | 9,938,444 | 521 | 551 |
| Nebraska | 1,711,263 | 501 | 228 |
| Utah | 2,233,169 | 493 | 387 |
| Connecticut | 3,405,565 | 455 | 315 |
| Arkansas | 2,673,400 | 442 | 277 |
| New Mexico | 1,819,046 | 420 | 385 |
| Wisconsin | 5,363,675 | 387 | 329 |
| Alaska | 626,932 | 380 | 287 |
| Minnesota | 4,919,479 | 378 | 349 |
| Iowa | 2,926,324 | 313 | 259 |
| Rhode Island | 1,048,319 | 232 | 128 |
| Delaware | 783,600 | 215 | 104 |
| South Dakota | 754,844 | 148 | 68 |
| District of Columbia | 572,059 | 111 | 76 |
| New Hampshire | 1,235,786 | 110 | 85 |
| Montana | 902,195 | 107 | 121 |
| Wyoming | 493,782 | 101 | 73 |
| West Virginia | 1,808,344 | 80 | 114 |
| Maine | 1,274,923 | 67 | 85 |
| North Dakota | 642,200 | 65 | 61 |
| Vermont | 608,827 | 43 | 38 |
| Puerto Rico | 3,808,610 | 30 | 64 |
SY 2017 Table 21.1 Chamorro Population, United States and Insular Areas: 2000
Statistical Yearbook 2017 CNMI CSD
NOTE: Chamorro – “Guamanian or Chamorro” selected or written entries “Guam” or “Chamorro” (2000 and 2010 Census definition)
NOTE: Part-Chamorro – Chamorro and one or more additional race (2000 and 2010 Census definition)
| Total Population | Chamorro | Part-Chamorro | |
|---|---|---|---|
| Source: 1980, 1990, 2000 and 2010 Censuses of Population and Housing | |||
| United States | 281,421,906 | 58,240 | 34,371 |
| California | 33,871,648 | 20,918 | 12,931 |
| Washington | 5,894,121 | 5,823 | 2,774 |
| Texas | 20,851,820 | 3,641 | 1,769 |
| Florida | 15,982,378 | 2,319 | 1,230 |
| Nevada | 1,998,257 | 1,346 | 744 |
| Georgia | 8,186,453 | 1,566 | 607 |
| Hawaii | 1,211,537 | 1,663 | 2,558 |
| Arizona | 5,130,632 | 1,354 | 747 |
| North Carolina | 8,049,313 | 1,313 | 515 |
| New York | 18,976,457 | 1,931 | 815 |
| Virginia | 7,078,515 | 1,310 | 735 |
| Colorado | 4,301,261 | 1,124 | 743 |
| Alabama | 4,447,100 | 577 | 227 |
| Oregon | 3,421,399 | 1,015 | 653 |
| Tennessee | 5,689,283 | 696 | 266 |
| Maryland | 5,296,486 | 708 | 400 |
| Ohio | 11,353,140 | 618 | 499 |
| Illinois | 12,419,293 | 988 | 508 |
| South Carolina | 4,012,012 | 489 | 256 |
| Missouri | 5,595,211 | 435 | 326 |
| Pennsylvania | 12,281,054 | 646 | 391 |
| Oklahoma | 3,450,654 | 585 | 381 |
| New Jersey | 8,414,350 | 779 | 356 |
| Kentucky | 4,041,769 | 403 | 213 |
| Louisiana | 4,468,976 | 342 | 242 |
| Massachusetts | 6,349,097 | 529 | 283 |
| Indiana | 6,080,485 | 470 | 262 |
| Kansas | 2,688,418 | 325 | 240 |
| Mississippi | 2,844,658 | 213 | 168 |
| Idaho | 1,293,953 | 254 | 132 |
| Michigan | 9,938,444 | 622 | 385 |
| Nebraska | 1,711,263 | 273 | 166 |
| Utah | 2,233,169 | 202 | 146 |
| Connecticut | 3,405,565 | 281 | 131 |
| Arkansas | 2,673,400 | 231 | 139 |
| New Mexico | 1,819,046 | 363 | 171 |
| Wisconsin | 5,363,675 | 332 | 241 |
| Alaska | 626,932 | 227 | 160 |
| Minnesota | 4,919,479 | 266 | 217 |
| Iowa | 2,926,324 | 170 | 123 |
| Rhode Island | 1,048,319 | 248 | 66 |
| Delaware | 783,600 | 89 | 43 |
| South Dakota | 754,844 | 58 | 46 |
| District of Columbia | 572,059 | 62 | 42 |
| New Hampshire | 1,235,786 | 83 | 35 |
| Montana | 902,195 | 73 | 68 |
| Wyoming | 493,782 | 65 | 35 |
| West Virginia | 1,808,344 | 87 | 69 |
| Maine | 1,274,923 | 70 | 53 |
| North Dakota | 642,200 | 30 | 39 |
| Vermont | 608,827 | 28 | 25 |
| Puerto Rico | 3,808,610 | 149 | 85 |
SY 2017 Table 21.1 Chamorro Population, United States and Insular Areas: 1990
Statistical Yearbook 2017 CNMI CSD
NOTE: Reported as “Guamanian” in 1980 and 1990 stateside Census results
| Total Population | Guamanian | |
|---|---|---|
| Source: 1980, 1990, 2000 and 2010 Censuses of Population and Housing | ||
| United States | 248,709,873 | 47,754 |
| California | 29,760,021 | 23,783 |
| Washington | 4,866,692 | 3,816 |
| Texas | 16,986,510 | 2,592 |
| Florida | 12,937,926 | 1,188 |
| Nevada | 1,201,833 | 411 |
| Georgia | 6,478,216 | 571 |
| Hawaii | 1,108,229 | 2,357 |
| Arizona | 3,665,228 | 570 |
| North Carolina | 6,628,637 | 583 |
| New York | 17,990,455 | 1,332 |
| Virginia | 6,187,358 | 971 |
| Colorado | 3,294,394 | 668 |
| Alabama | 4,040,587 | 196 |
| Oregon | 2,842,321 | 887 |
| Tennessee | 4,877,185 | 306 |
| Maryland | 4,781,468 | 625 |
| Ohio | 10,847,115 | 279 |
| Illinois | 11,430,602 | 1,083 |
| South Carolina | 3,486,703 | 213 |
| Missouri | 5,117,073 | 235 |
| Pennsylvania | 11,881,643 | 345 |
| Oklahoma | 3,145,585 | 450 |
| New Jersey | 7,730,188 | 447 |
| Kentucky | 3,685,296 | 249 |
| Louisiana | 4,219,973 | 306 |
| Massachusetts | 6,016,425 | 527 |
| Indiana | 5,544,159 | 218 |
| Kansas | 2,477,574 | 260 |
| Mississippi | 2,573,216 | 44 |
| Idaho | 1,006,749 | 148 |
| Michigan | 9,295,297 | 279 |
| Nebraska | 1,578,385 | 148 |
| Utah | 1,722,850 | 110 |
| Connecticut | 3,287,116 | 123 |
| Arkansas | 2,350,725 | 163 |
| New Mexico | 1,515,069 | 270 |
| Wisconsin | 4,891,769 | 180 |
| Alaska | 550,043 | 245 |
| Minnesota | 4,375,099 | 150 |
| Iowa | 2,776,755 | 48 |
| Rhode Island | 1,003,464 | 104 |
| Delaware | 666,168 | 21 |
| South Dakota | 696,004 | 30 |
| District of Columbia | 606,900 | 25 |
| New Hampshire | 1,109,252 | 27 |
| Montana | 799,065 | 32 |
| Wyoming | 453,588 | 12 |
| West Virginia | 1,793,477 | 24 |
| Maine | 1,227,928 | 79 |
| North Dakota | 638,800 | 8 |
| Vermont | 562,758 | 16 |
| Puerto Rico | —— | —— |
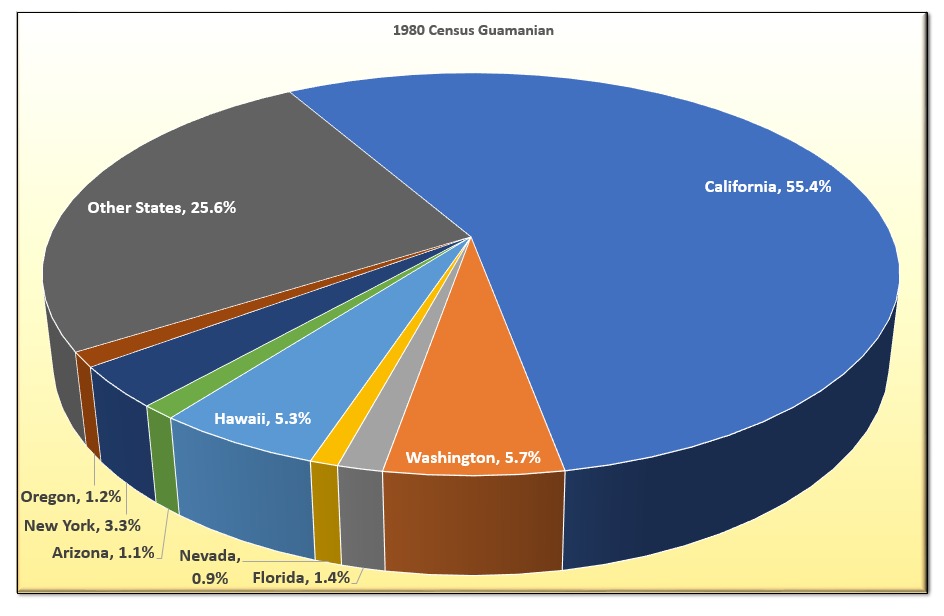
SY 2017 Table 21.1 Chamorro Population, United States and Insular Areas: 1980
Statistical Yearbook 2017 CNMI CSD
NOTE: Reported as “Guamanian” in 1980 and 1990 stateside Census results
| Total Population | Guamanian | |
|---|---|---|
| Source: 1980, 1990, 2000 and 2010 Censuses of Population and Housing | ||
| United States | 226,545,805 | 30,695 |
| California | 23,667,902 | 17,009 |
| Washington | 4,132,156 | 1,739 |
| Texas | 14,229,191 | 1,229 |
| Florida | 9,746,324 | 442 |
| Nevada | 800,493 | 275 |
| Georgia | 5,463,105 | 503 |
| Hawaii | 964,691 | 1,630 |
| Arizona | 2,718,215 | 346 |
| North Carolina | 5,881,766 | 388 |
| New York | 17,558,072 | 1,017 |
| Virginia | 5,346,818 | 548 |
| Colorado | 2,889,964 | 506 |
| Alabama | 3,893,888 | 62 |
| Oregon | 2,633,105 | 366 |
| Tennessee | 4,591,120 | 66 |
| Maryland | 4,216,975 | 323 |
| Ohio | 10,797,630 | 137 |
| Illinois | 11,426,518 | 367 |
| South Carolina | 3,121,820 | 182 |
| Missouri | 4,916,686 | 203 |
| Pennsylvania | 11,863,895 | 164 |
| Oklahoma | 3,025,290 | 261 |
| New Jersey | 7,364,823 | 199 |
| Kentucky | 3,660,777 | 208 |
| Louisiana | 4,205,900 | 230 |
| Massachusetts | 5,737,037 | 251 |
| Indiana | 5,490,224 | 119 |
| Kansas | 2,363,679 | 259 |
| Mississippi | 2,520,638 | 87 |
| Idaho | 943,935 | 42 |
| Michigan | 9,262,078 | 199 |
| Nebraska | 1,569,825 | 109 |
| Utah | 1,461,037 | 64 |
| Connecticut | 3,107,576 | 100 |
| Arkansas | 2,286,435 | 65 |
| New Mexico | 1,302,894 | 43 |
| Wisconsin | 4,705,767 | 162 |
| Alaska | 401,851 | 129 |
| Minnesota | 4,075,970 | 102 |
| Iowa | 2,913,808 | 95 |
| Rhode Island | 947,154 | 116 |
| Delaware | 594,338 | 45 |
| South Dakota | 690,768 | 46 |
| District of Columbia | 638,333 | 89 |
| New Hampshire | 920,610 | 5 |
| Montana | 786,690 | 11 |
| Wyoming | 469,557 | 10 |
| West Virginia | 1,949,644 | 29 |
| Maine | 1,124,660 | 79 |
| North Dakota | 652,717 | 18 |
| Vermont | 511,456 | 21 |
| Puerto Rico | —— | —— |
Ch.21 CHAMORRO in U.S.
To download, right click on the chart and select “Save Image As”…