DescriptionTable DataChart and Figure Data
Ch.21 CHAMORRO in U.S.
Ch.21 CHAMORRO in U.S.
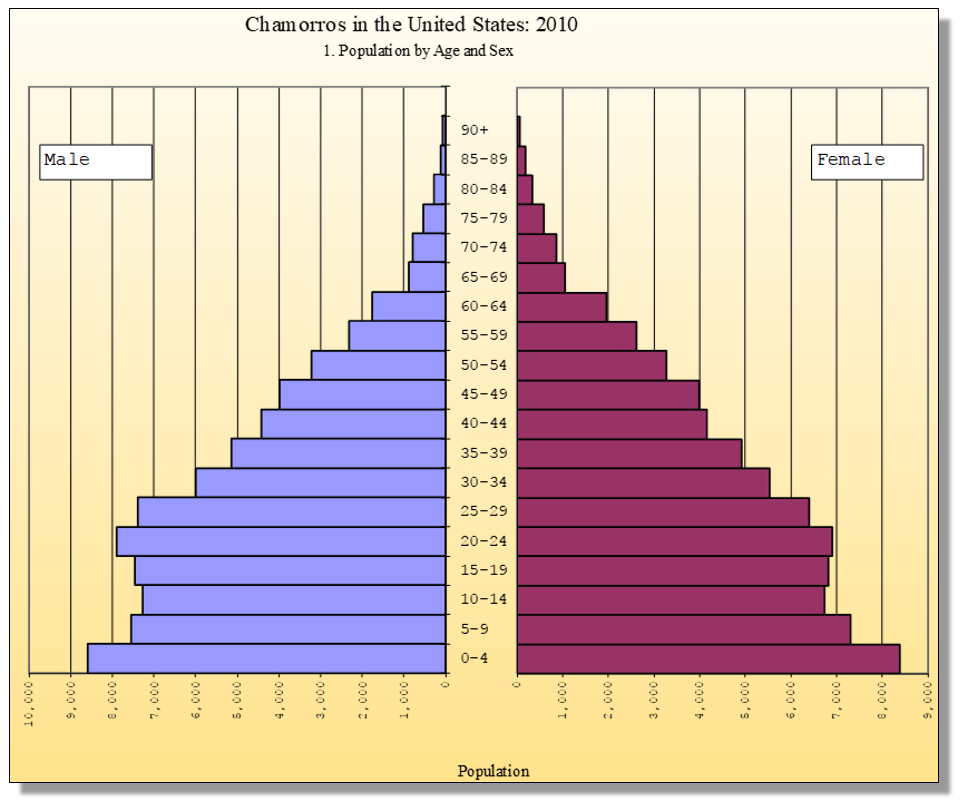
SY 2017 Table 21.3 Chamorros in the United States by Age and Sex: 2010
Statistical Yearbook 2017 CNMI CSD
Note: Sorting unavailable due to the table format
| Age Group | Male | Male | Female | Female | Males per 100 females |
|---|---|---|---|---|---|
| Source: 2010 Census Summary File 2 | |||||
| Under 5 years | 8,592 | 11.4% | 8,397 | 11.6% | 102.3% |
| 5 to 9 years | 7,549 | 10.0% | 7,308 | 10.1% | 103.3% |
| 10 to 14 years | 7,275 | 9.6% | 6,735 | 9.3% | 108.0% |
| 15 to 19 years | 7,462 | 9.9% | 6,833 | 9.5% | 109.2% |
| 20 to 24 years | 7,895 | 10.4% | 6,906 | 9.6% | 114.3% |
| 25 to 29 years | 7,385 | 9.8% | 6,405 | 8.9% | 115.3% |
| 30 to 34 years | 6,003 | 7.9% | 5,545 | 7.7% | 108.3% |
| 35 to 39 years | 5,138 | 6.8% | 4,922 | 6.8% | 104.4% |
| 40 to 44 years | 4,426 | 5.9% | 4,170 | 5.8% | 106.1% |
| 45 to 49 years | 3,986 | 5.3% | 3,985 | 5.5% | 100.0% |
| 50 to 54 years | 3,212 | 4.2% | 3,277 | 4.5% | 98.0% |
| 55 to 59 years | 2,318 | 3.1% | 2,611 | 3.6% | 88.8% |
| 60 to 64 years | 1,761 | 2.3% | 1,971 | 2.7% | 89.3% |
| 65 to 69 years | 869 | 1.1% | 1,048 | 1.5% | 82.9% |
| 70 to 74 years | 780 | 1.0% | 875 | 1.2% | 89.1% |
| 75 to 79 years | 524 | 0.7% | 582 | 0.8% | 90.0% |
| 80 to 84 years | 272 | 0.4% | 343 | 0.5% | 79.3% |
| 85 to 89 years | 112 | 0.1% | 187 | 0.3% | 59.9% |
| 90 years and over | 66 | 0.1% | 73 | 0.1% | 90.4% |
| Under 18 years | 27,818 | 36.8% | 26,508 | 36.7% | 104.9% |
| 18 to 64 years | 45,184 | 59.7% | 42,557 | 59.0% | 106.2% |
| 18 to 24 years | 10,955 | 14.5% | 9,671 | 13.4% | 113.3% |
| 25 to 44 years | 22,952 | 30.3% | 21,042 | 29.2% | 109.1% |
| 25 to 34 years | 13,388 | 17.7% | 11,950 | 16.6% | 112.0% |
| 35 to 44 years | 9,564 | 12.6% | 9,092 | 12.6% | 105.2% |
| 45 to 64 years | 11,277 | 14.9% | 11,844 | 16.4% | 95.2% |
| 45 to 54 years | 7,198 | 9.5% | 7,262 | 10.1% | 99.1% |
| 55 to 64 years | 4,079 | 5.4% | 4,582 | 6.3% | 89.0% |
| 65 years and over | 2,623 | 3.5% | 3,108 | 4.3% | 84.4% |
| 65 to 74 years | 1,649 | 2.2% | 1,923 | 2.7% | 85.8% |
| 75 to 84 years | 796 | 1.1% | 925 | 1.3% | 86.1% |
| 85 years and over | 178 | 0.2% | 260 | 0.4% | 68.5% |
| 16 years and over | 50,713 | 67.1% | 48,403 | 67.1% | 104.8% |
| 18 years and over | 47,807 | 63.2% | 45,665 | 63.3% | 104.7% |
| 21 years and over | 43,112 | 57.0% | 41,476 | 57.5% | 103.9% |
| 60 years and over | 4,384 | 5.8% | 5,079 | 7.0% | 86.3% |
| 62 years and over | 3,612 | 4.8% | 4,126 | 5.7% | 87.5% |
| 67 years and over | 2,250 | 3.0% | 2,667 | 3.7% | 84.4% |
| 75 years and over | 974 | 1.3% | 1,185 | 1.6% | 82.2% |
| Median age (years) | 24.4 | ( X ) | 24.9 | ( X ) | ( X ) |
Ch.21 CHAMORRO in U.S.
To download, right click on the chart and select “Save Image As”…