DescriptionTable DataChart and Figure Data
Ch.22 HISTORICAL
Ch.22 HISTORICAL
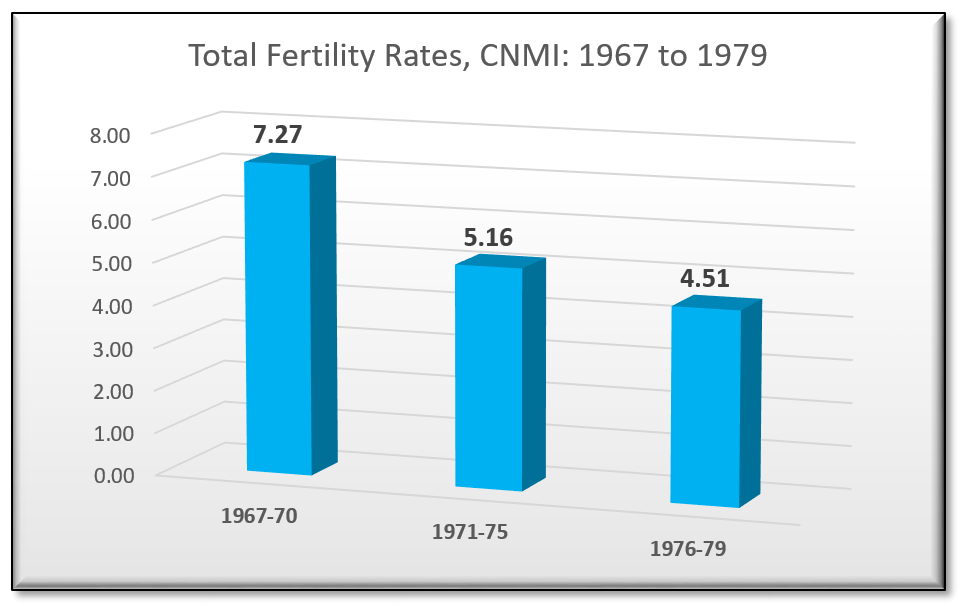
SY 2017 Table 22.18 Age Specific and Total Fertility Rates: 1967 to 1979 (WOMEN)
Statistical Yearbook 2017 CNMI CSD
| Women | 1976-1979 | 1971-1975 | 1967-1970 |
|---|---|---|---|
| Source: Numerators from registered births, Denominators interpolated from 1967 and 1973 census | |||
| 15 to 19 | 3,443 | 4,222 | 2,969 |
| 20 to 24 | 3,018 | 3,243 | 1,765 |
| 25 to 29 | 2,464 | 2,247 | 1,182 |
| 30 to 34 | 1,874 | 1,591 | 985 |
| 35 to 39 | 1,310 | 1,465 | 925 |
| 40 to 44 | 1,126 | 1,188 | 703 |
| 45 to 49 | 905 | 891 | 635 |
SY 2017 Table 22.18 Age Specific and Total Fertility Rates: 1967 to 1979 (BIRTHS)
Statistical Yearbook 2017 CNMI CSD
| Births | 1976-1979 | 1971-1975 | 1967-1970 |
|---|---|---|---|
| Source: Numerators from registered births, Denominators interpolated from 1967 and 1973 census | |||
| 15 to 19 | 391 | 472 | 351 |
| 20 to 24 | 803 | 953 | 611 |
| 25 to 29 | 591 | 552 | 396 |
| 30 to 34 | 293 | 310 | 314 |
| 35 to 39 | 115 | 177 | 221 |
| 40 to 44 | 40 | 77 | 60 |
| 45 to 49 | 2 | 1 | 7 |
SY 2017 Table 22.18 Age Specific and Total Fertility Rates: 1967 to 1979 (ASFR)
Statistical Yearbook 2017 CNMI CSD
| ASFR | 1976-1979 | 1971-1975 | 1967-1970 |
|---|---|---|---|
| Source: Numerators from registered births, Denominators interpolated from 1967 and 1973 census | |||
| 15 to 19 | 113.6% | 111.8% | 118.2% |
| 20 to 24 | 266.1% | 293.9% | 346.2% |
| 25 to 29 | 239.9% | 245.7% | 335.0% |
| 30 to 34 | 156.4% | 194.8% | 318.8% |
| 35 to 39 | 87.8% | 120.8% | 238.9% |
| 40 to 44 | 35.5% | 64.8% | 85.3% |
| 45 to 49 | 2.2% | 1.1% | 11.0% |
| TFR | 4506.8% | 5164.6% | 7267.5% |
Ch.22 HISTORICAL
To download, right click on the chart and select “Save Image As”…