DescriptionTable DataChart and Figure Data
Ch.22 HISTORICAL
Ch.22 HISTORICAL
SY 2017 Table 22.3 Change in the Native Population: 1920 to 1935 by Taeuber and Han
Statistical Yearbook 2017 CNMI CSD
| Chamorros | Chamorros Change from previous year % |
Carolinians | Carolinians Change from previous year % |
Chamorros % | |
|---|---|---|---|---|---|
| Source: Japanese Censuses of 1930 and 1935 | |||||
| 1935 | 3,720 | 12.7% | 577 | 9.3% | 86.6% |
| 1930 | 3,301 | 11.8% | 528 | -2.4% | 86.2% |
| 1925 | 2,952 | 4.5% | 541 | -5.7% | 84.5% |
| 1920 | 2,824 | . . . | 574 | . . . | 83.1% |
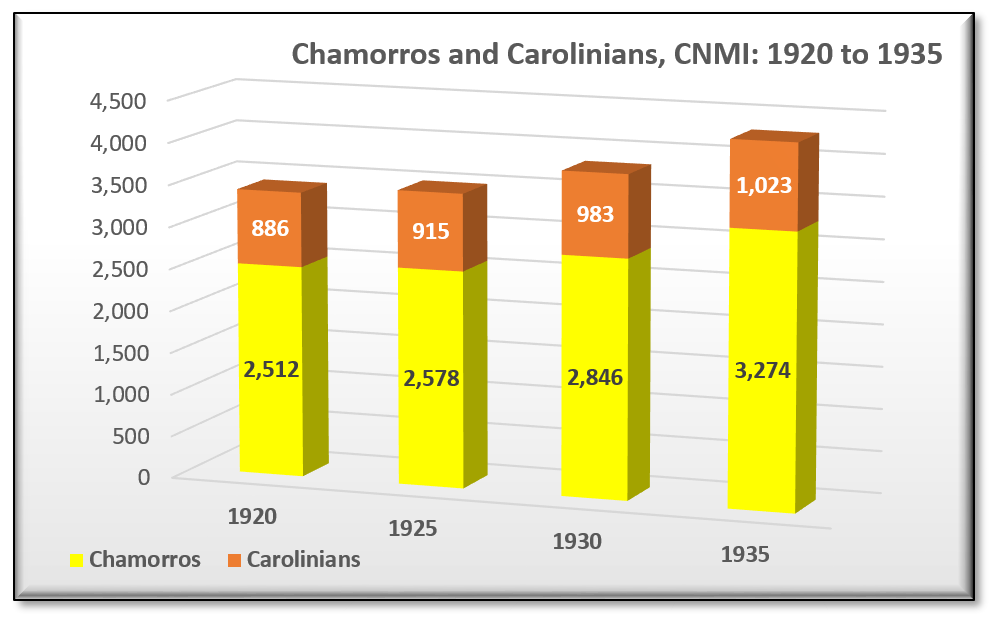
SY 2017 Table 22.3 Change in the Native Population: 1920 to 1935 by Borja and Levin
Statistical Yearbook 2017 CNMI CSD
| Chamorros | Chamorros Change from previous year % |
Carolinians | Carolinians Change from previous year % |
Chamorros % | |
|---|---|---|---|---|---|
| Source: Japanese Censuses of 1930 and 1935 | |||||
| 1935 | 3,274 | 15.0% | 1,023 | 4.1% | 76.2% |
| 1930 | 2,846 | 10.4% | 983 | 7.4% | 74.3% |
| 1925 | 2,578 | 2.6% | 915 | 3.3% | 73.8% |
| 1920 | 2,512 | . . . | 886 | . . . | 73.9% |
Ch.22 HISTORICAL
To download, right click on the chart and select “Save Image As”…