DescriptionTable DataChart and Figure Data
Ch.3 EDUCATION
Ch.3 EDUCATION
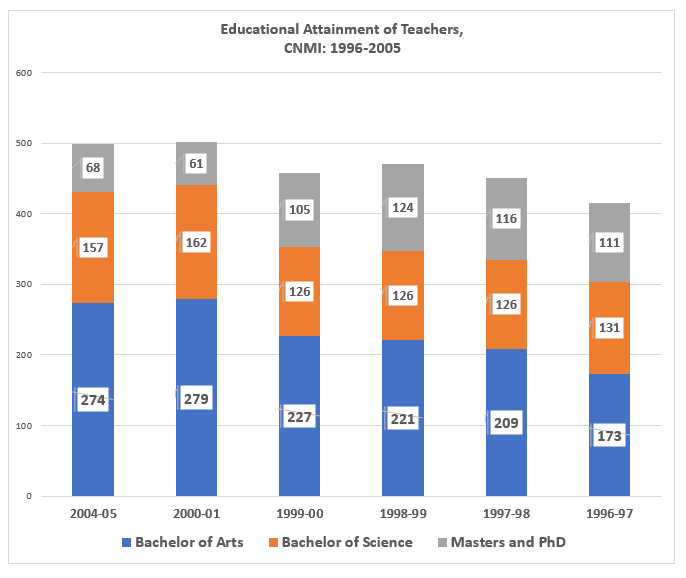
SY 2017 Table 3.15 Educational Background of Teachers, CNMI: SY 1996-1997 to SY 2004-05
Statistical Yearbook 2017 CNMI CSD
Note: 2002 data not available
| 2004-05 | 2000-01 | 1999-00 | 1998-99 | 1997-98 | 1996-97 | |
|---|---|---|---|---|---|---|
| Source: Northern Marianas College | ||||||
| Associate of Arts | 2 | 2 | 2 | 14 | 18 | 26 |
| Associate of Science | 0 | 0 | 0 | 0 | 0 | 0 |
| Bachelor of Arts | 274 | 279 | 227 | 221 | 209 | 173 |
| Bachelor of Science | 157 | 162 | 126 | 126 | 126 | 131 |
| Master of Arts | 67 | 60 | 104 | 122 | 115 | 109 |
| Doctorate Degree, Phd | 1 | 1 | 1 | 2 | 1 | 2 |
SY 2017 Table 3.16 Student-Teacher Ratio by School Level, CNMI: SY 1996-1997 to SY 2003-2004
Statistical Yearbook 2017 CNMI CSD
Note: “?” means data not available
| 2003-04 | 2002-03 | 2001-02 | 2000-01 | 1999-00 | 1998-99 | 1997-98 | 1996-97 | ||
|---|---|---|---|---|---|---|---|---|---|
| Source: Public School System | |||||||||
| Public School | Elementary (1-6 grade) | 19 | 21 | 19 | 19 | 20 | 19 | 19 | 20 |
| Public School | Junior High (7-8 grade) | 18 | 18 | 18 | 18 | 21 | 20 | 19 | 20 |
| Public School | High School (9-12 grade) | 22 | 21 | 19 | 17 | 17 | 18 | 17 | 17 |
| Private School | Elementary | 13 | 14 | 15 | 15 | 17 | 19 | ||
| Private School | Secondary | 13 | 13 | 10 | 13 | 13 | 14 |
To download HD image, right click on image and select “Save Image As”…