DescriptionTable DataChart and Figure Data
Ch.3 EDUCATION
Ch.3 EDUCATION
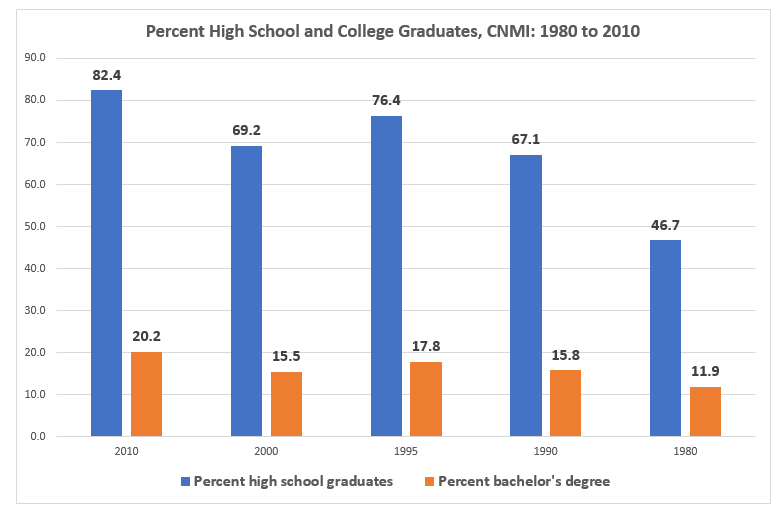
SY 2017 Table 3.3 Educational Attainment by District and Island, CNMI: 1980 to 2010
Statistical Yearbook 2017 CNMI CSD
Universe: Population 25 years and over enrolled in school
| 2010 | 2000 | 1995 | 1990 | 1980 | |
|---|---|---|---|---|---|
| Source: U.S. Census Bureau Universe: Population 25 years and over enrolled in school |
|||||
| Less than 9th grade | 2,550 | 5,794 | 4,099 | 3,994 | 2,832 |
| 9th to 12th grade. No diploma | 3,187 | 7,181 | 4,056 | 4,016 | 898 |
| High school graduate (inc equiv) | 12,063 | 14,986 | 13,106 | 8,659 | 1,501 |
| Some college, no degree | 5,987 | 5,293 | 4,396 | 2,627 | 937 |
| Assosiate’s degree | 2,230 | 2,341 | 2,708 | 1,191 | |
| Bachelor’s degree | 5,383 | 5,342 | 5,202 | 3,234 | 637 |
| Graduate or professional degree | 1,202 | 1,186 | 957 | 621 | 195 |
| Percent high school graduates | 82.40% | 69.20% | 76.40% | 67.10% | 46.70% |
| Percent bachelor’s degree | 20.20% | 15.50% | 17.80% | 15.80% | 11.90% |
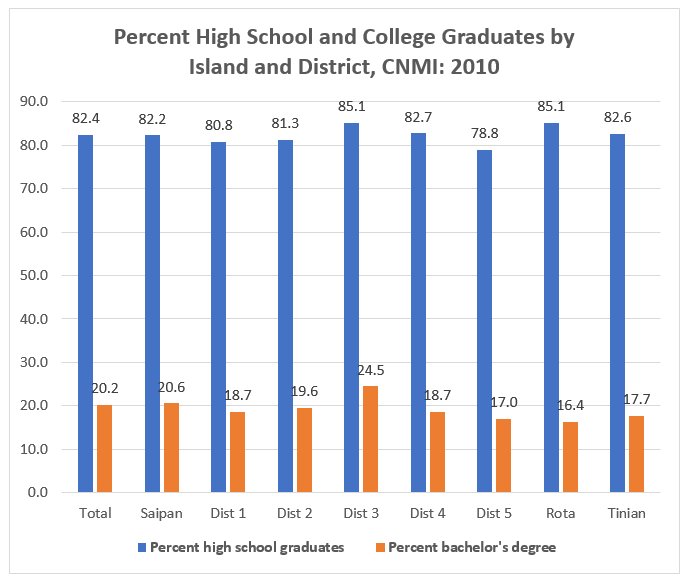
SY 2017 Table 3.4 Educational Attainment by District and Island, CNMI: 2010
Statistical Yearbook 2017 CNMI CSD
Universe: Population 25 years and over enrolled in school
| Saipan District 1 |
Saipan District 2 |
Saipan District 3 |
Saipan District 4 |
Saipan District 5 |
Rota District 7 |
Tinian District 6 |
|
|---|---|---|---|---|---|---|---|
| Source: U.S. Census Bureau Universe: Population 25 years and over enrolled in school |
|||||||
| Less than 9th grade | 752 | 370 | 680 | 155 | 354 | 124 | 115 |
| 9th to 12th grade. No diploma | 946 | 377 | 818 | 243 | 463 | 109 | 231 |
| High school graduate (inc equiv) | 3,361 | 1,596 | 3,476 | 853 | 1,410 | 633 | 734 |
| Some college, no degree | 1618 | 599 | 1,885 | 469 | 728 | 308 | 380 |
| Assosiate’s degree | 535 | 271 | 714 | 155 | 249 | 134 | 172 |
| Bachelor’s degree | 1,357 | 676 | 2,034 | 308 | 485 | 217 | 306 |
| Graduate or professional degree | 297 | 108 | 418 | 122 | 172 | 39 | 46 |
| Percent high school graduates | 80.8% | 81.3% | 85.1% | 82.7% | 78.8% | 85.1% | 82.6% |
| Percent bachelor’s degree | 18.7% | 19.6% | 24.5% | 18.7% | 17.0% | 16.4% | 17.7% |
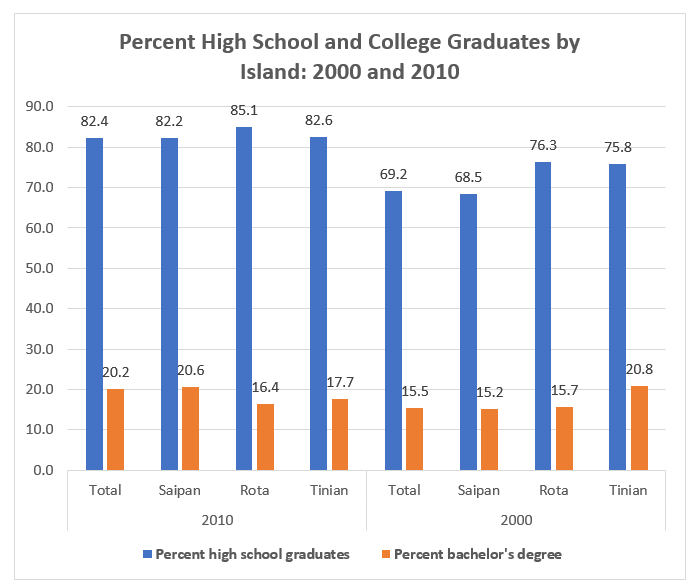
SY 2017 Table 3.5 Educational Attainment by District and Island, CNMI: 2010
Statistical Yearbook 2017 CNMI CSD
Universe: Population 25 years and over enrolled in school
| Saipan 2010 |
Rota 2010 |
Tinian 2010 |
Saipan 2000 |
Rota 2000 |
Tinian 2000 |
|
|---|---|---|---|---|---|---|
| Source: U.S. Census Bureau Universe: Population 25 years and over enrolled in school |
||||||
| Less than 9th grade | 2,311 | 124 | 115 | 5,358 | 242 | 193 |
| 9th to 12th grade. No diploma | 2,847 | 109 | 231 | 6,649 | 202 | 330 |
| High school graduate (inc equiv) | 10,696 | 633 | 734 | 13,652 | 664 | 668 |
| Some college, no degree | 5,299 | 308 | 380 | 4,565 | 337 | 391 |
| Assosiate’s degree | 1,924 | 134 | 172 | 2,076 | 135 | 130 |
| Bachelor’s degree | 4,860 | 217 | 306 | 4,698 | 252 | 392 |
| Graduate or professional degree | 1,117 | 39 | 46 | 1,085 | 43 | 58 |
| Percent high school graduates | 82.2% | 85.1% | 82.6% | 68.5% | 76.3% | 75.8% |
| Percent bachelor’s degree | 20.6% | 16.4% | 17.7% | 15.2% | 15.7% | 20.8% |
To download HD image, right click on image and select “Save Image As”…