DescriptionTable DataChart and Figure Data
Ch.4 LABOR
Ch.4 LABOR
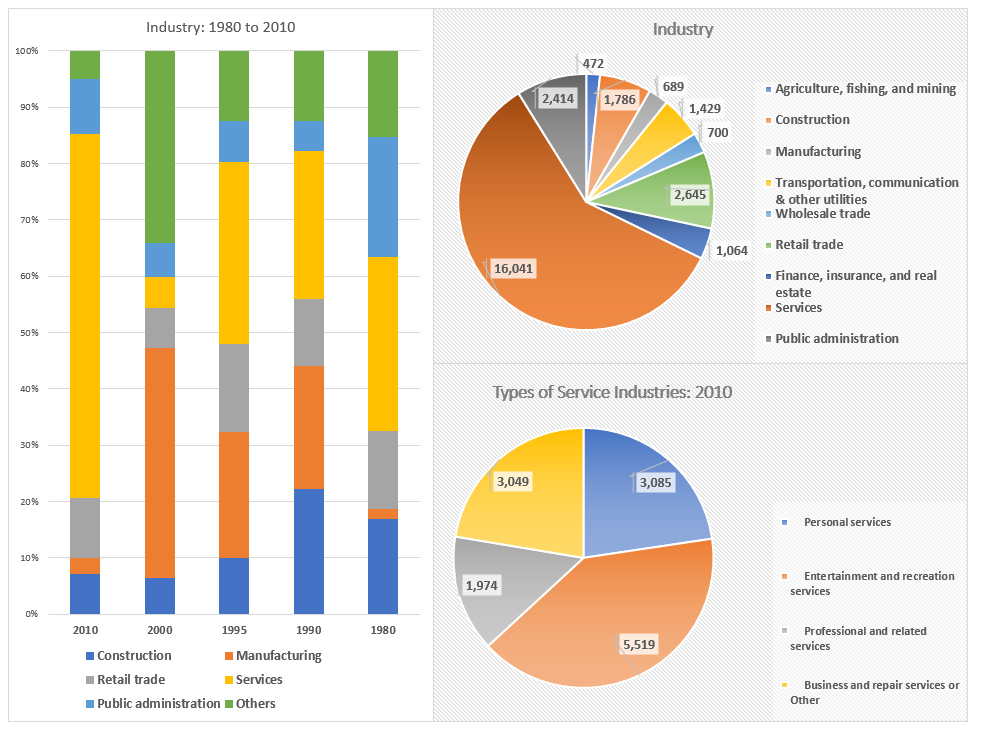
SY 2017 Table 4.12 Employed Persons by Industry, CNMI: 1980 to 2010
Statistical Yearbook 2017 CNMI CSD
Universe: Employed persons 16 years and over
| 2010 | 2000 | 1995 | 1990 | 1980 | |
|---|---|---|---|---|---|
| Source: Recent Trends in Population, Labor Force Survey Table A13.0 and Census 2000 Population and Housing Profiles and 2010 Census | |||||
| Agriculture, fishing, and mining | 472 | 623 | 557 | 700 | 126 |
| Construction | 1,786 | 2,785 | 3,489 | 5,767 | 1,000 |
| Manufacturing | 689 | 17,398 | 7,770 | 5,688 | 110 |
| Transportation, communication & other utilities | 1,429 | 1,449 | 2,540 | 1,635 | 517 |
| Wholesale trade | 700 | 680 | 518 | 365 | 101 |
| Retail trade | 2,645 | 3,056 | 5,462 | 3,090 | 818 |
| Finance, insurance, and real estate | 1,064 | 1,013 | 723 | 518 | 163 |
| Personal services | 3,085 | – | 5,103 | 3,353 | 706 |
| Entertainment and recreation services | 5,519 | – | 860 | 544 | 54 |
| Professional and related services | 1,974 | 2,117 | 3,360 | 2,059 | 895 |
| Business and repair services or Other | 3,049 | – | 1,560 | 837 | 181 |
| Public administration | 2,414 | 2,583 | 2,552 | 1,409 | 1,264 |
To download HD image, right click on image and select “Save Image As”…