DescriptionTable DataChart and Figure Data
Ch.4 LABOR
Ch.4 LABOR
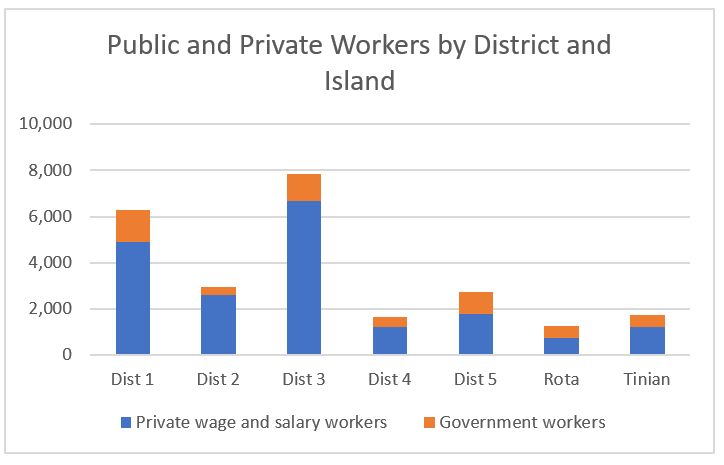
SY2017 Table 4.18 Class of Worker by District and Island, CNMI: 2010
Statistical Yearbook 2017 CNMI CSD
Universe: Civilian employed population 16 years and over
| Class of Worker | Saipan District 1 |
Saipan District 2 |
Saipan District 3 |
Saipan District 4 |
Saipan District 5 |
Rota District 7 |
Tinian District 6 |
|---|---|---|---|---|---|---|---|
| Source: U.S. Census Bureau | |||||||
| Private wage and salary workers | 4,895 | 2,587 | 6,689 | 1,202 | 1,771 | 741 | 1,207 |
| Government workers | 1,370 | 342 | 1,154 | 448 | 963 | 504 | 532 |
| Self-employed and family | 119 | 54 | 130 | 43 | 49 | 13 | 13 |
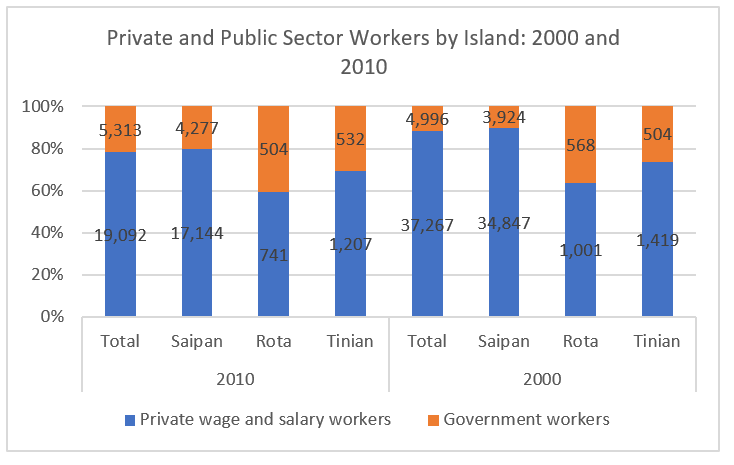
SY 2017 Table 4.19 Class of Worker by District and Island, CNMI: 2010-2000
Statistical Yearbook 2017 CNMI CSD
Universe: Civilian employed population 16 years and over
| Class of Worker | Saipan 2010 | Rota 2010 | Tinian 2010 | Saipan 2000 | Rota 2000 | Tinian 2000 |
|---|---|---|---|---|---|---|
| Source: U.S. Census Bureau | ||||||
| Private wage and salary workers | 17,144 | 741 | 1,207 | 34,847 | 1,001 | 1,419 |
| Government workers | 4,277 | 504 | 532 | 3,924 | 568 | 504 |
| Self-employed and family | 395 | 13 | 13 | 452 | 22 | 15 |
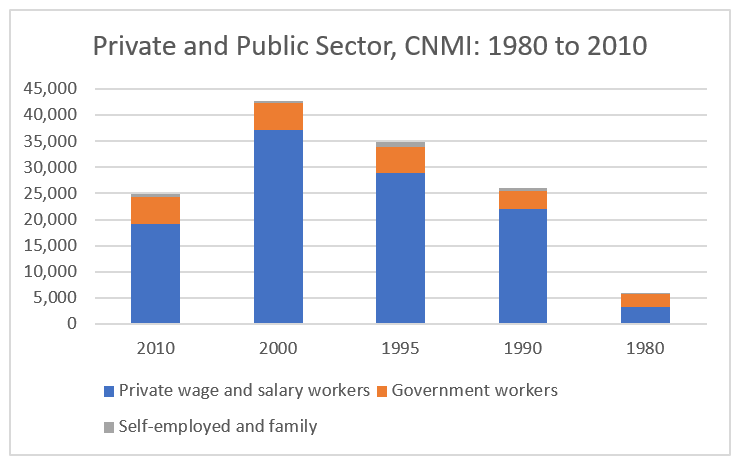
SY 2017 Table 4.20 Class of Worker by District and Island, CNMI: 2010-1980
Statistical Yearbook 2017 CNMI CSD
Universe: Civilian employed population 16 years and over
| Class of Worker | 2010 | 2000 | 1995 | 1990 | 1980 |
|---|---|---|---|---|---|
| Source: U.S. Census Bureau | |||||
| Private wage and salary workers | 19,092 | 37,268 | 28,841 | 22,027 | 3,308 |
| Government workers | 5,313 | 4,996 | 5,018 | 3,510 | 2,500 |
| Self-employed and family | 421 | 489 | 953 | 428 | 133 |
To download HD image, right click on image and select “Save Image As”…