DescriptionTable DataChart and Figure Data
Ch.4 LABOR
Ch.4 LABOR
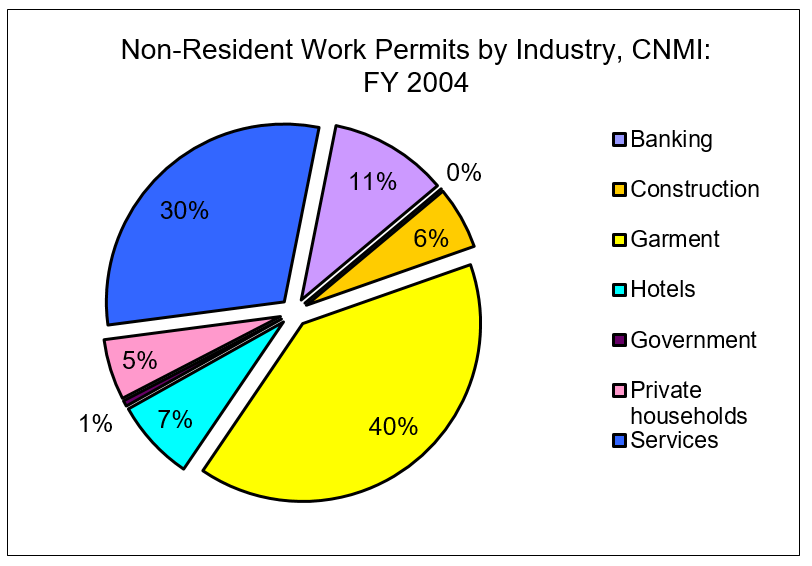
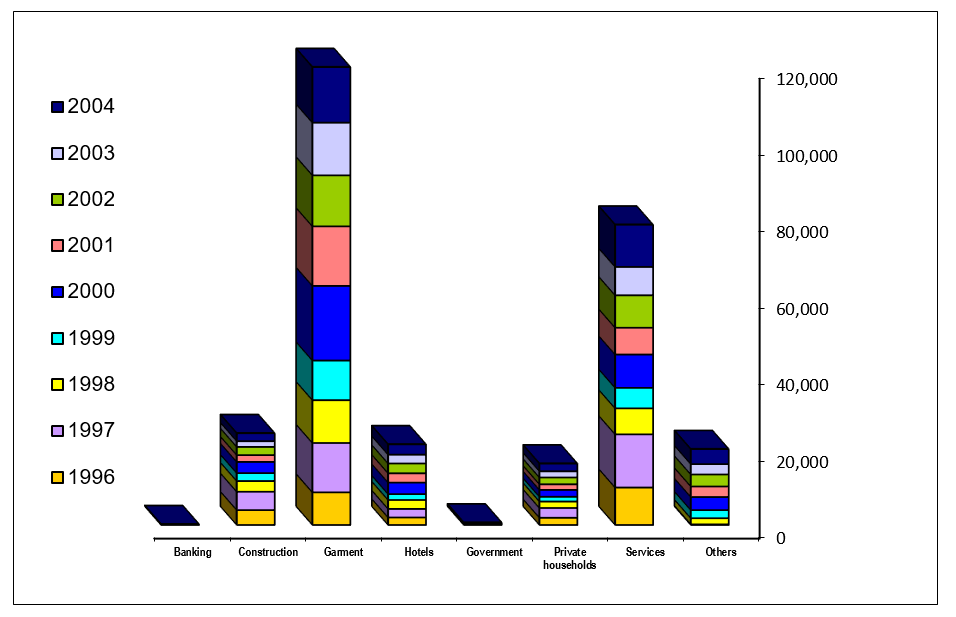
SY 2017 Table 4.24 Non-Resident Work Permits Issued by Industry, CNMI: FY 1996 to FY 2004
Statistical Yearbook 2017 CNMI CSD
| Employment Sector | 2004 | 2003 | 2002 | 2001 | 2000 | 1999 | 1998 | 1997 | 1996 |
|---|---|---|---|---|---|---|---|---|---|
| Source: Department of Labor & Immigration, LIIDS | |||||||||
| Banking | 11 | 15 | 5 | 16 | 12 | 10 | 31 | 52 | 53 |
| Construction | 2,076 | 1,500 | 2,143 | 1,777 | 2,922 | 2,070 | 2,794 | 4,780 | 3,878 |
| Garment | 14,513 | 13,742 | 13,320 | 15,536 | 19,470 | 10,342 | 11,177 | 12,889 | 8,498 |
| Hotels | 2,687 | 2,298 | 2,557 | 2,430 | 3,008 | 1,540 | 2,328 | 2,231 | 1,946 |
| Government | 193 | 93 | 53 | 65 | 93 | 45 | 32 | 23 | 30 |
| Private households | 2,012 | 1,615 | 1,775 | 1,461 | 1,800 | 1,237 | 1,690 | 2,548 | 1,869 |
| Services | 11,000 | 7,411 | 8,454 | 7,007 | 8,688 | 5,357 | 6,773 | 13,883 | 9,763 |
| Others | 3,916 | 2,706 | 3,127 | 2,751 | 3,418 | 2,116 | 1,586 | 160 | 2 |
To download HD image, right click on image and select “Save Image As”…


